Open Source SECS/GEM Protocol Library
General 2026. 1. 27. 14:52 |반응형
반응형
'General' 카테고리의 다른 글
| Windows 11 SMB 서버 네트워크 드라이브 인식 실패 (feat. ipTIME 공유기 with USB) (0) | 2025.12.19 |
|---|---|
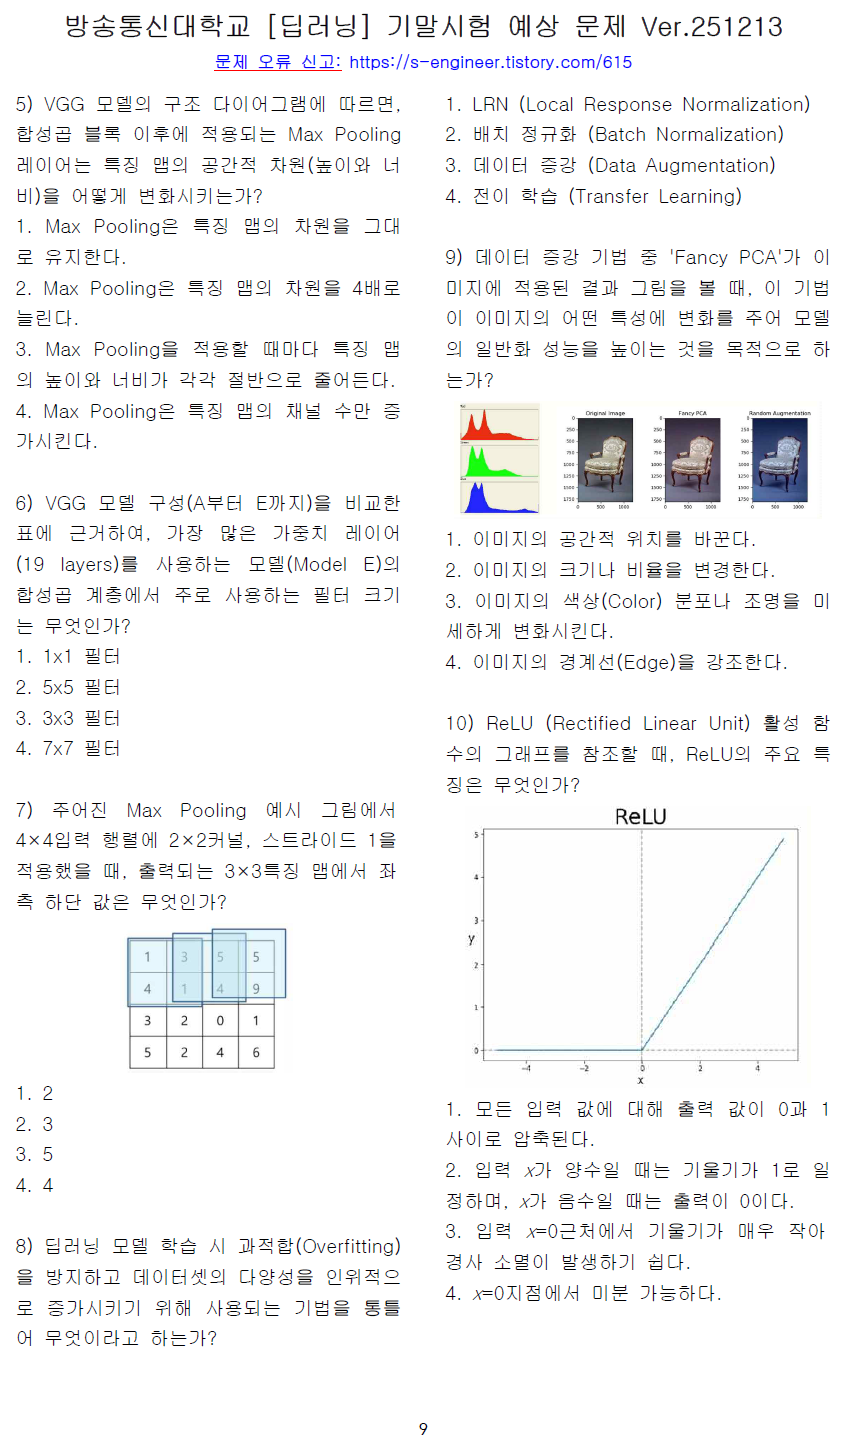
| 방송통신대학교(방송대/방통대) 오픈소스 기반 데이터분석 / 딥러닝 기말 대비 예상 문제 (4) | 2025.12.03 |
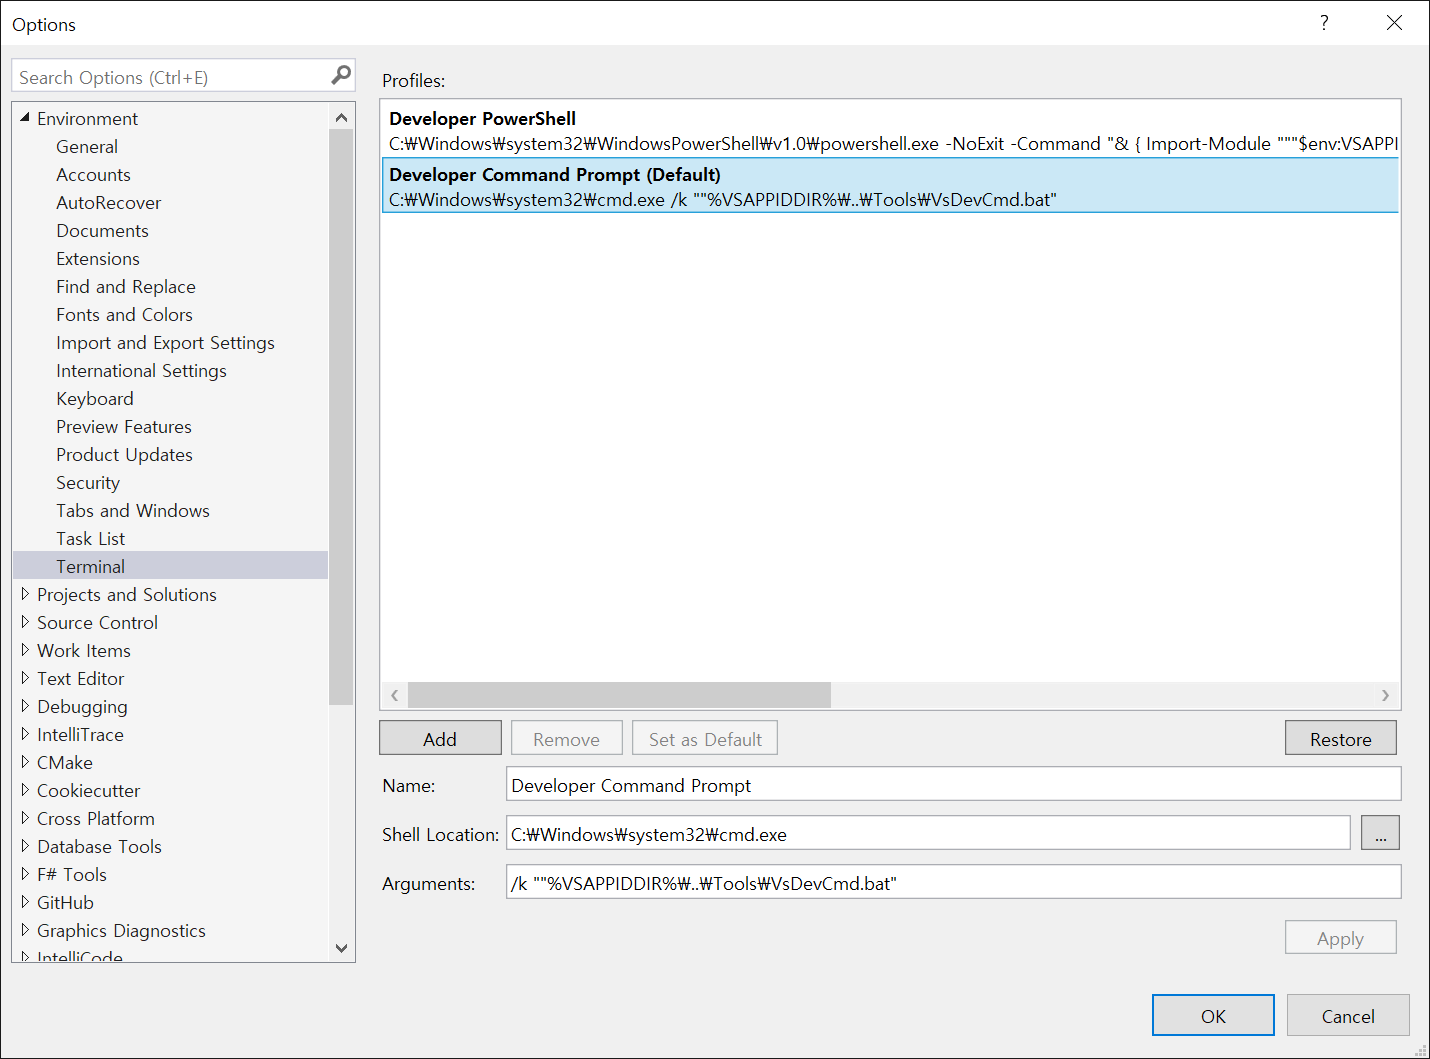
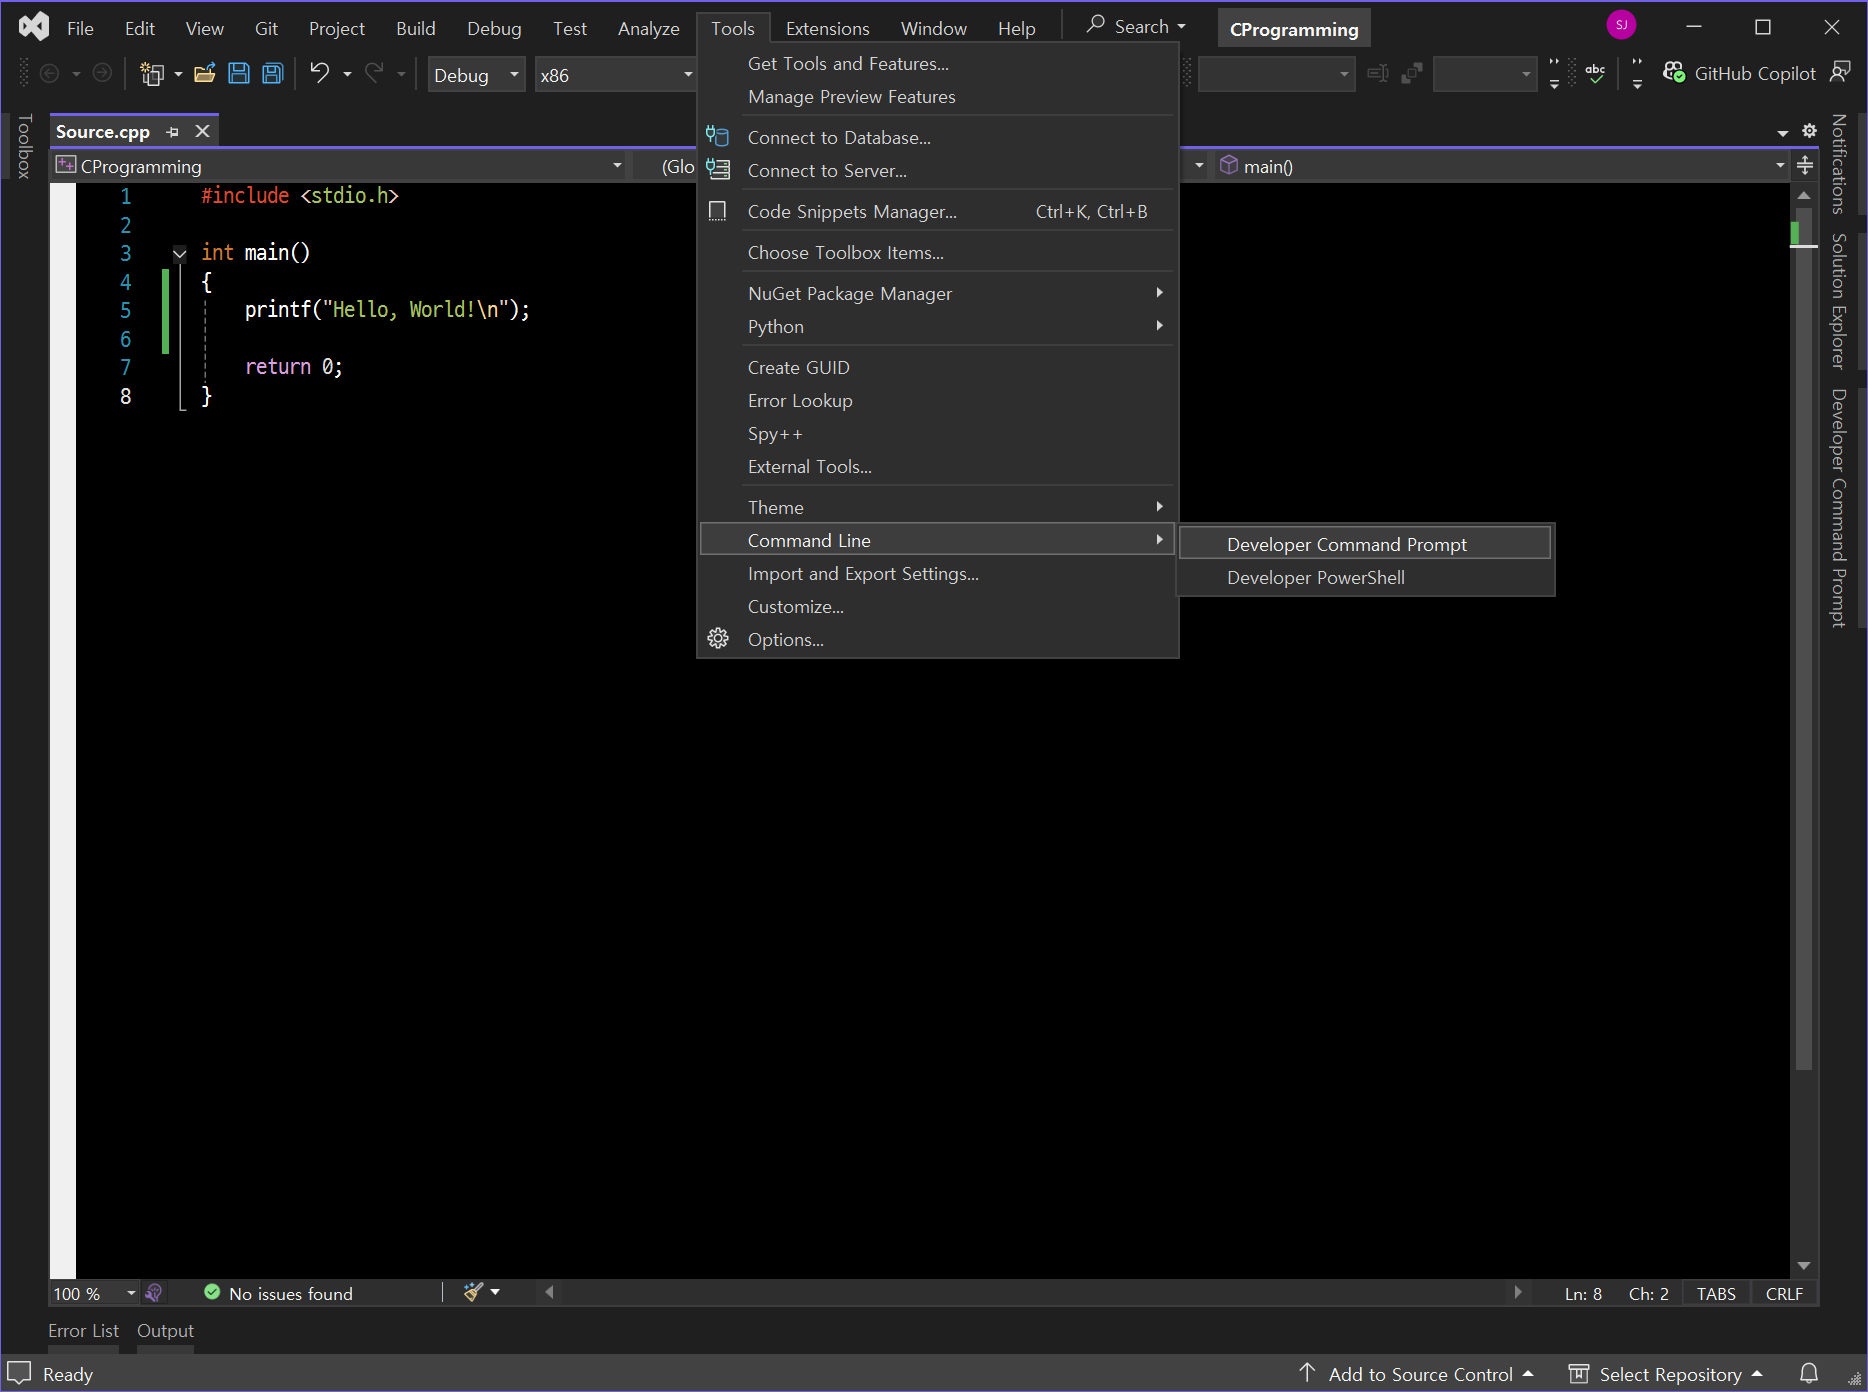
| [Visual Studio] 비주얼 스튜디오 Terminal - Developer Command Prompt / PowerShell (0) | 2025.11.25 |
| 방송통신대학교(방송대/방통대) 오픈소스 기반 데이터분석 공공 데이터 수집 분석 (0) | 2025.10.19 |
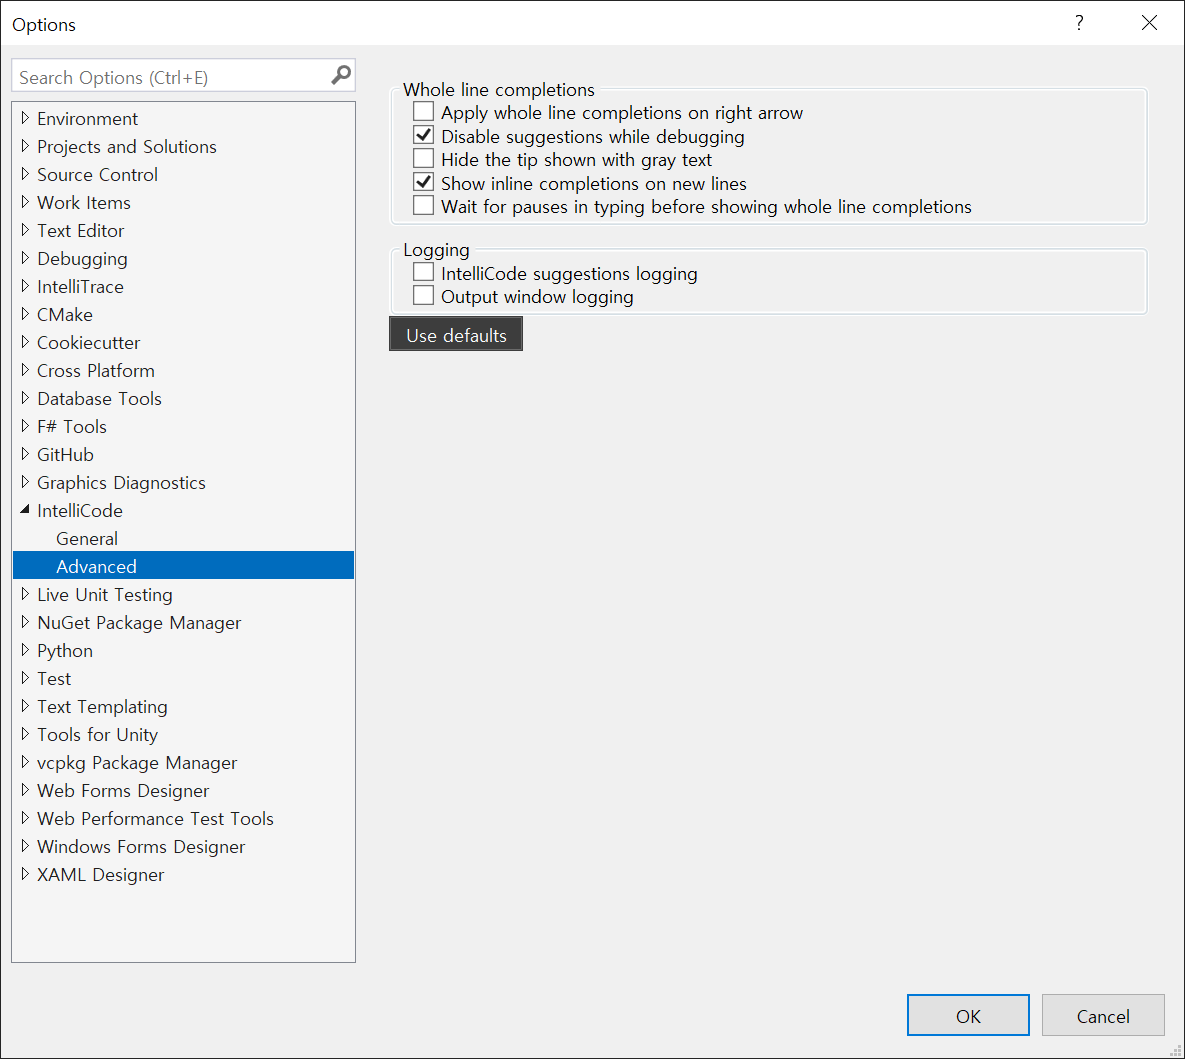
| [Visual Studio] IntelliCode 비주얼 스튜디오 코드 자동 완성 (0) | 2025.10.19 |