반응형

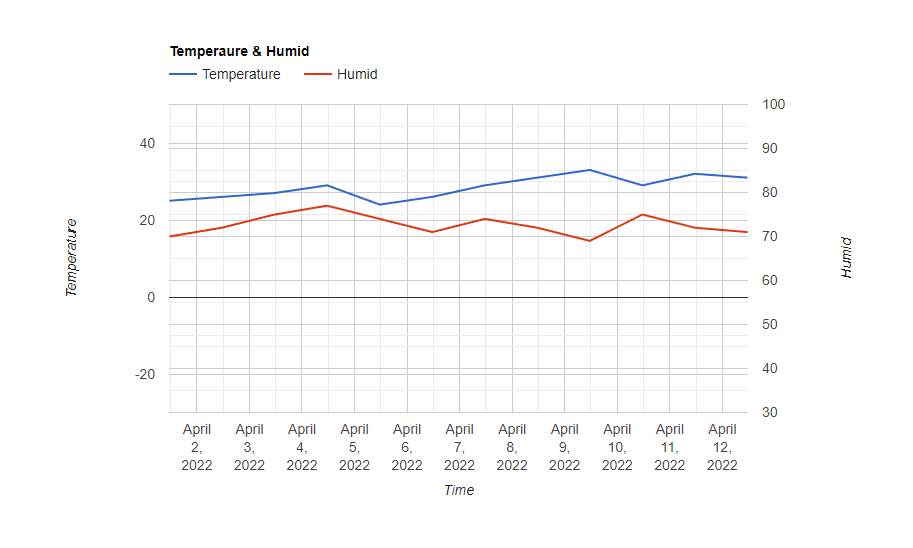
구글 차트를 이용해 웹페이지에 그래프(Dual-Y Chart)를 그려보자.


서버가 필요하다면 아래 링크를 참고해 서버를 만든다.

2021.08.25 - [Linux] - Linux(Ubuntu) Build Your Own Web Server - 리눅스(우분투)로 웹서버 만들기


1
2
3
4
5
6
7
8
9
10
11
12
13
14
15
16
17
18
19
20
21
22
23
24
25
26
27
28
29
30
31
32
33
34
35
36
37
38
39
40
41
42
43
44
45
46
47
48
49
50
51
52
53
54
55
56
57
58
59
60
61
62
<html>
<head>
    <script type="text/javascript" src="https://www.gstatic.com/charts/loader.js"></script>
    <script type="text/javascript">
        google.charts.load('current', { packages: ['corechart''line'] });
        google.charts.setOnLoadCallback(drawChart);
 
        function drawChart() {
            var data = new google.visualization.DataTable();
            data.addColumn('datetime''Time');
            data.addColumn('number''Temperature');
            data.addColumn('number''Humid');
 
            data.addRows([
                // 00: 1월, 01: 2월, 02: 3월...
                [new Date(202203011130), 2570],
                [new Date(202203021130), 2672],
                [new Date(202203031130), 2775],
                [new Date(202203041130), 2977],
                [new Date(202203051130), 2474],
                [new Date(202203061130), 2671],
                [new Date(202203071130), 2974],
                [new Date(202203081130), 3172],
                [new Date(202203091130), 3369],
                [new Date(202203101130), 2975],
                [new Date(202203111130), 3272],
                [new Date(202203121130), 3171]
            ]);
 
            var options = {
                title: 'Temperaure & Humid',
                hAxis: {
                    title: 'Time'
                },
                series: {
                    0: { targetAxisIndex: 0 },
                    1: { targetAxisIndex: 1 }
                },
                vAxes: {
                    0: {
                        title: 'Temperature',
                        viewWindow: { min: -30, max: 50 }
                    },
                    1: {
                        title: 'Humid',
                        viewWindow: { min: 30, max: 100 }
                    }
                }
                //,
                //curveType: 'function',
                //legend: { position: 'bottom' }
            };
 
            var chart = new google.visualization.LineChart(document.getElementById('chart_div'));
            chart.draw(data, options);
        }
    </script>
</head>
<body>
    <div id="chart_div" style="width: 900px; height: 500px"></div>
</body>
</html>


HTML소스를 입력하고 저장한다.


인터넷 브라우저로 열어보면 그래프가 나타난다.


※ 참고

Google Charts

반응형
Posted by J-sean
:
반응형

간단한 웹서버용 HTML 문서 작성 예제


2019/10/08 - [Linux] - Build your own web server with Fedora linux - 페도라 리눅스로 간단한 웹서버 만들기


아래 내용으로 index.html 파일을 작성 하고 /var/www/html에 저장 한다.

1
2
3
4
5
6
7
8
9
10
11
12
13
14
15
16
17
18
19
20
21
22
23
24
25
26
27
28
29
30
31
32
33
34
35
36
<!doctype html>
<html lang="ko">
    <head>
        <meta charset="utf-8">
        <title>J.Sean's simple web server</title>
        <style>
            a{
                text-decoration:none;
                color:black;
            }
 
        </style>
    </head>
 
    <body>
        <h1>
        <br>--- J.sean's simple web server ---
        <br>OS: Fedora
        <br>HTTP Server: Apache
        <br>
        <a href="https://s-engineer.tistory.com/" target="_blank">Click me to visit J.Sean's blog</a><br><br>
 
        Alien 3<br>
        <video src="./data/Alien.mp4" width="960" height="520" autoplay controls>
        <track label="Korean" kind="subtitles" srclang="ko" src="./data/Alien.vtt" default></video><br><br>
        
        <a href="https://s-engineer.tistory.com/" target="_blank">
        <img src="./download/animal.jpg">
        </a>
 
        <br>
        <a href="./download/file.zip" download>File (file.zip)</a><br>
 
        </h1>
    </body>
</html>


./data, ./download 디렉토리를 만들고 index.html 내용에 필요한 데이터를 저장 한다.


서버에 접속하면 비디오 플레이어, 웹링크, 파일링크, 사진등이 표시된 웹 페이지가 열린다.


반응형
Posted by J-sean
:
반응형

웹서버로 만든 웹페이지에서 JSON 데이터를 분석하고 테이블이나 리스트등 원하는 형식으로 보여 줄 수 있다.


2019/10/08 - [Linux] - Build your own web server with Fedora linux - 페도라 리눅스로 간단한 웹서버 만들기


웹페이지에 보여 줄 데이터를 준비한다.


데이터를 JSON 형식으로 변환 한다. 아래 링크에서 간단히 변환 할 수 있다.

https://shancarter.github.io/mr-data-converter/


변환된 데이터는 data.json 파일로 저장 한다.


html/data 디렉토리를 만들고 data.json 파일을 저장 한다.


아래 파일과 같은 내용으로 index.php를 만들고 html 디렉토리에 저장 한다.


1
2
3
4
5
6
7
8
9
10
11
12
13
14
15
16
17
18
19
20
21
22
23
24
25
26
27
28
29
30
31
32
33
34
35
36
37
38
39
40
41
42
43
44
45
46
47
48
49
50
51
52
53
54
55
56
57
58
59
60
61
62
63
64
65
66
67
68
<?php
    $file_contents = file_get_contents('./data/data.json');
    $data = json_decode($file_contents, true);
?>
 
<!DOCTYPE html>
<html>
    <head>
        <meta charset="UTF-8">
        <title>PHP JSON parser sample</title>
    </head>
   
    <body>
    <table border="1" bordercolor="blue">
 
    <tr bgcolor="yellow">
    <th> 날짜 </th>
    <th> 아이템 </th>
    <th> 가격 </th>
    <th> 수량 </th>
    <th> 합계 </th>
    </tr>
 
    <?php foreach ($data as $row) { ?>
        <tr align="center">
 
        <td> <?php print $row['date']; ?> </td>
        
        <td> <?php print $row['item']; ?> </td>
        
        <td> <?php print $row['price']; ?> </td>
        
        <td> <?php print $row['quantity']; ?> </td>
        
        <td> <?php print $row['total']; ?> </td>
 
        </tr>
        
    <?php } ?>
 
    </table>
 
 
    <?php
    foreach ($data as $row) {
        print $row['date'];
        print ' , ';
        print $row['item'];
        print ' , ';
        print $row['price'];
        print ' , ';
        print $row['quantity'];
        print ' , ';
        print $row['total'];
        print '<br />';
    }
    ?>
 
 
    <?php
    foreach ($data as $row) {
        printf("<li>%s %s %s %s %s</li>\n", $row['date'], $row['item'], $row['price'], $row['quantity'], $row['total']);
    }
    ?>
    
    </body>
 
</html>


서버에 접속하면 data.json의 내용이 index.php에 설정한대로 표시된다.


반응형
Posted by J-sean
: