[ML] MNIST pandas
AI, ML, DL 2024. 12. 21. 17:24 |반응형
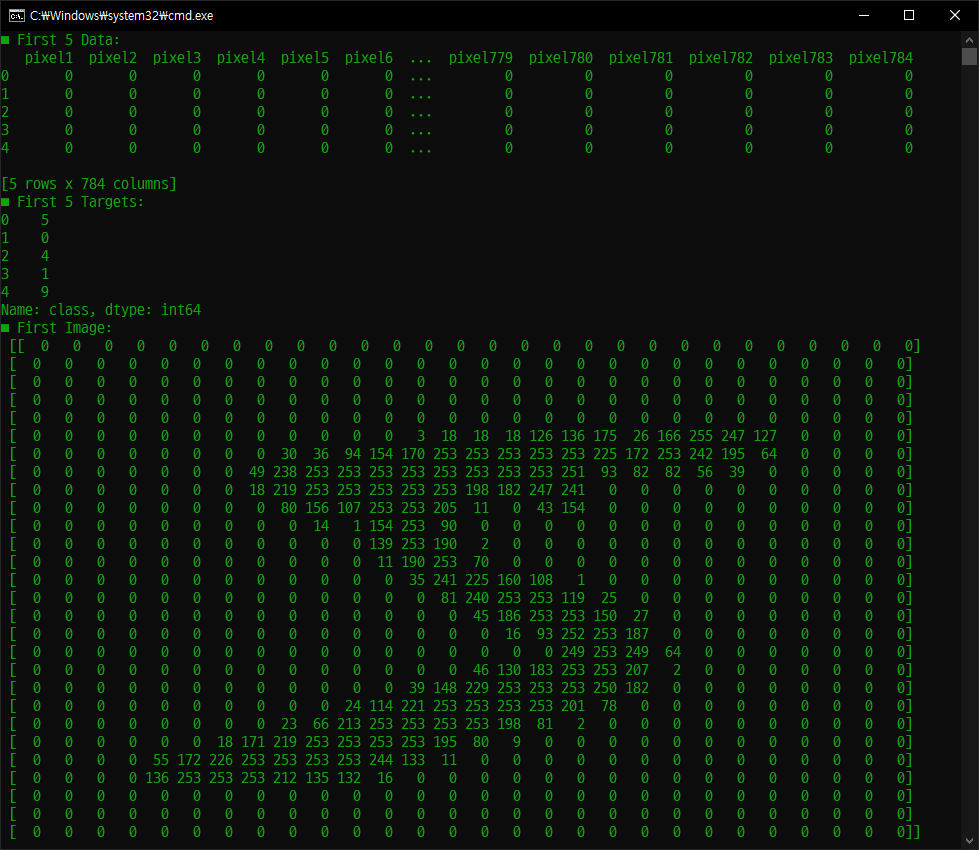
MNIST 데이터를 pandas로 읽고 출력해 보자.
|
1
2
3
4
5
6
7
8
9
10
11
12
13
14
15
16
17
18
19
20
21
22
23
24
25
|
import numpy as np
import pandas as pd
import matplotlib.pyplot as plt
#from sklearn.datasets import fetch_openml
#mnist = fetch_openml('mnist_784', as_frame=False)
#X, y = mnist.data, mnist.target
np.set_printoptions(linewidth=np.inf)
mnist = pd.read_csv("mnist_784.csv")
print("■ First 5 Data:")
print(mnist.iloc[0:5, 0:-1])
print("■ First 5 Targets:")
print(mnist.iloc[0:5, -1])
FirstImage = mnist.iloc[0, 0:-1].to_numpy().reshape(28, 28)
# values: Return a Numpy representation of the DataFrame,
# the axes labels will be removed.
print("■ First Image:\n", FirstImage)
plt.imshow(FirstImage, cmap="binary")
plt.axis("off")
plt.show()
|


|
1
2
3
4
5
6
7
8
9
10
11
12
|
import numpy as np
import pandas as pd
import matplotlib.pyplot as plt
np.set_printoptions(linewidth=np.inf)
mnist = pd.read_csv("mnist_784.csv")
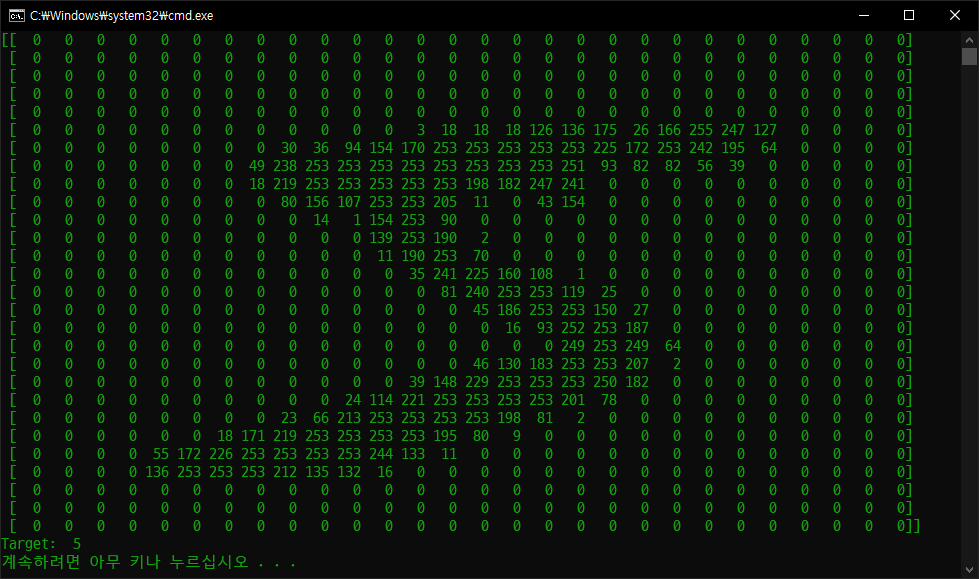
X = mnist.iloc[:, :-1].to_numpy().reshape(-1, 28, 28)
y = mnist.iloc[:, -1].to_numpy()
print(X[0])
print("Target: ", y[0])
|

Error: the number of classes has to be greater than one; got 1 class
|
1
2
3
4
5
6
7
8
9
10
11
12
13
14
15
16
17
18
19
20
21
22
23
24
25
26
27
|
import numpy as np
import pandas as pd
import matplotlib.pyplot as plt
from sklearn.linear_model import SGDClassifier
np.set_printoptions(linewidth=np.inf)
mnist = pd.read_csv("mnist_784.csv")
X = mnist.iloc[:, :-1].to_numpy()
y = mnist.iloc[:, -1].to_numpy().astype('str')
# .astype('str')을 삭제하면 y에 숫자 데이터가 저장된다. 그러면 21, 22 라인에서
# 문자5('5')와 비교하기 때문에 모두 False가 되어버려 타겟이 False 클래스 하나만
# 갖게 되어 아래와 같은 에러가 발생한다.
# The number of classes has to be greater than one; got 1 class
# 아니면 .astype('str')을 삭제하고 21, 22 라인에서 '5'가 아닌 5와 비교해도 된다.
first_digit = X[0]
# 첫 번째 데이터 지정.
X_train, X_test, y_train, y_test = X[:60000], X[60000:], y[:60000], y[60000:]
y_train_5 = (y_train == '5')
y_test_5 = (y_test == '5')
sgd_clf = SGDClassifier(random_state=42)
sgd_clf.fit(X_train, y_train_5)
print(sgd_clf.predict([first_digit]))
# 첫 번째 데이터가 5인지 확인.
|
첫 번째 데이터가 5인지 확인하는 코드.
결과로 True가 출력된다.
반응형
'AI, ML, DL' 카테고리의 다른 글
| [MediaPipe] Object Detection 객체 감지 (1) | 2025.02.11 |
|---|---|
| [DL] Keras(TensorFlow) 관련 에러 해결 (0) | 2025.01.15 |
| [Scraping] 환율 정보를 SMS로 보내기 (3) | 2024.01.02 |
| [Scraping] 환율 정보 (0) | 2024.01.02 |
| OCR with Tesseract on Windows - Windows에서 테서랙트 사용하기 (0) | 2020.10.07 |

