반응형

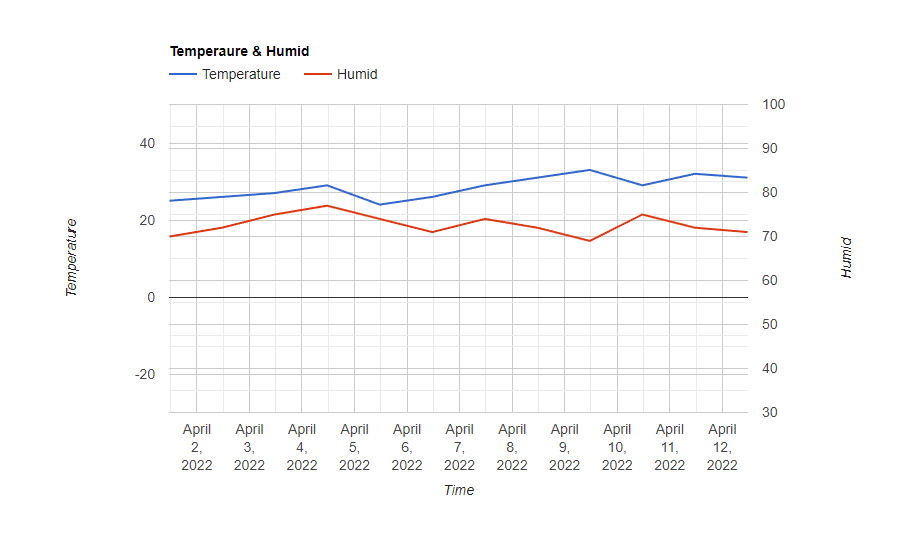
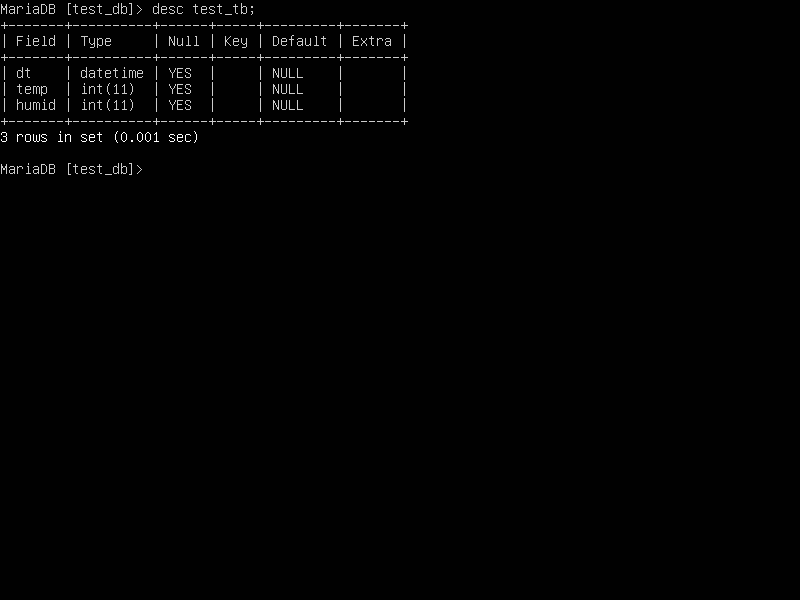
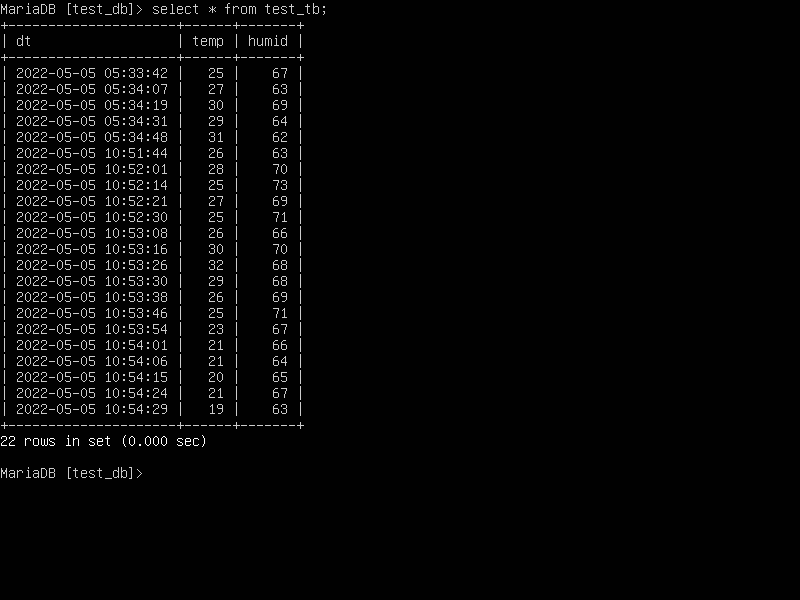
MySQL(MariaDB)과 구글 차트를 연동해 보자.


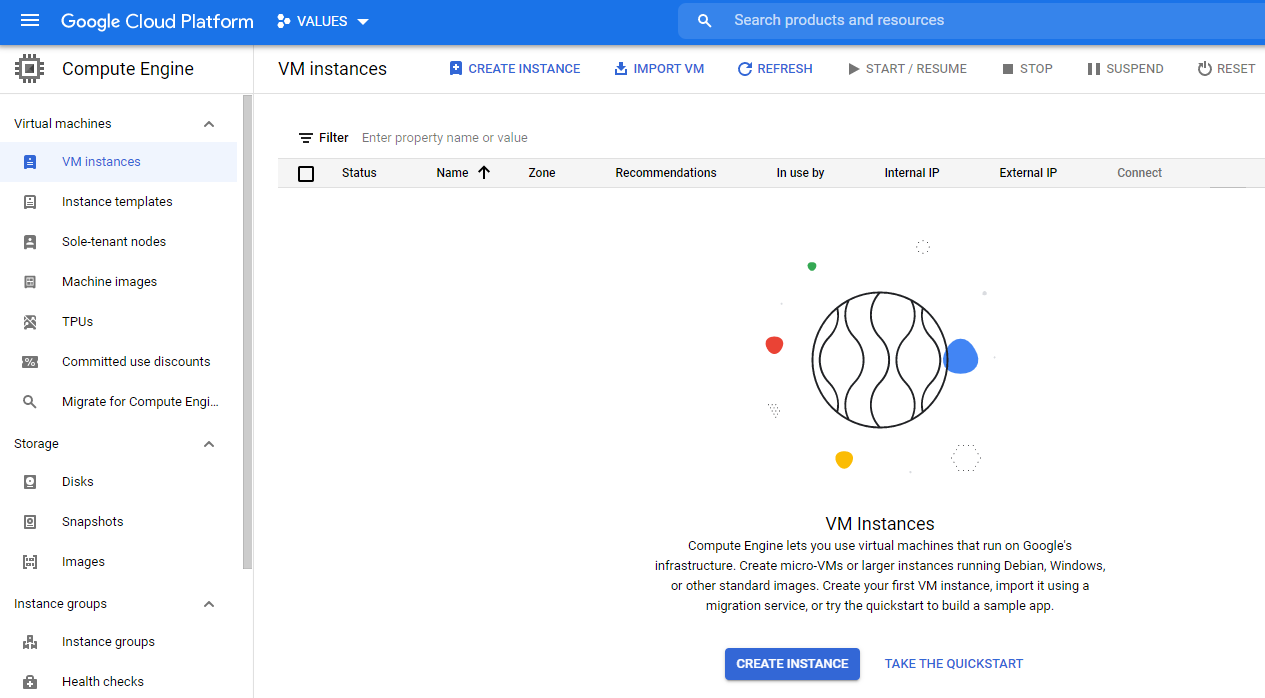
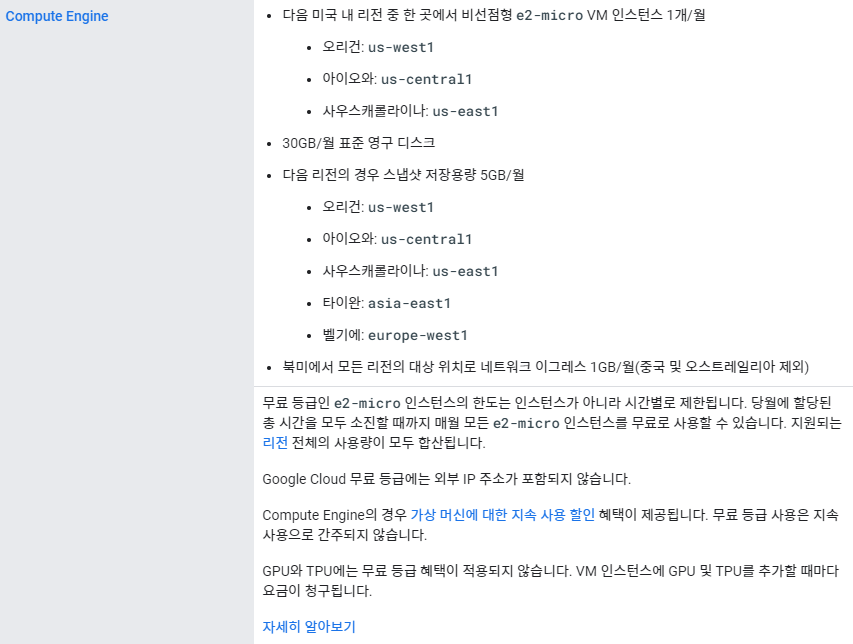
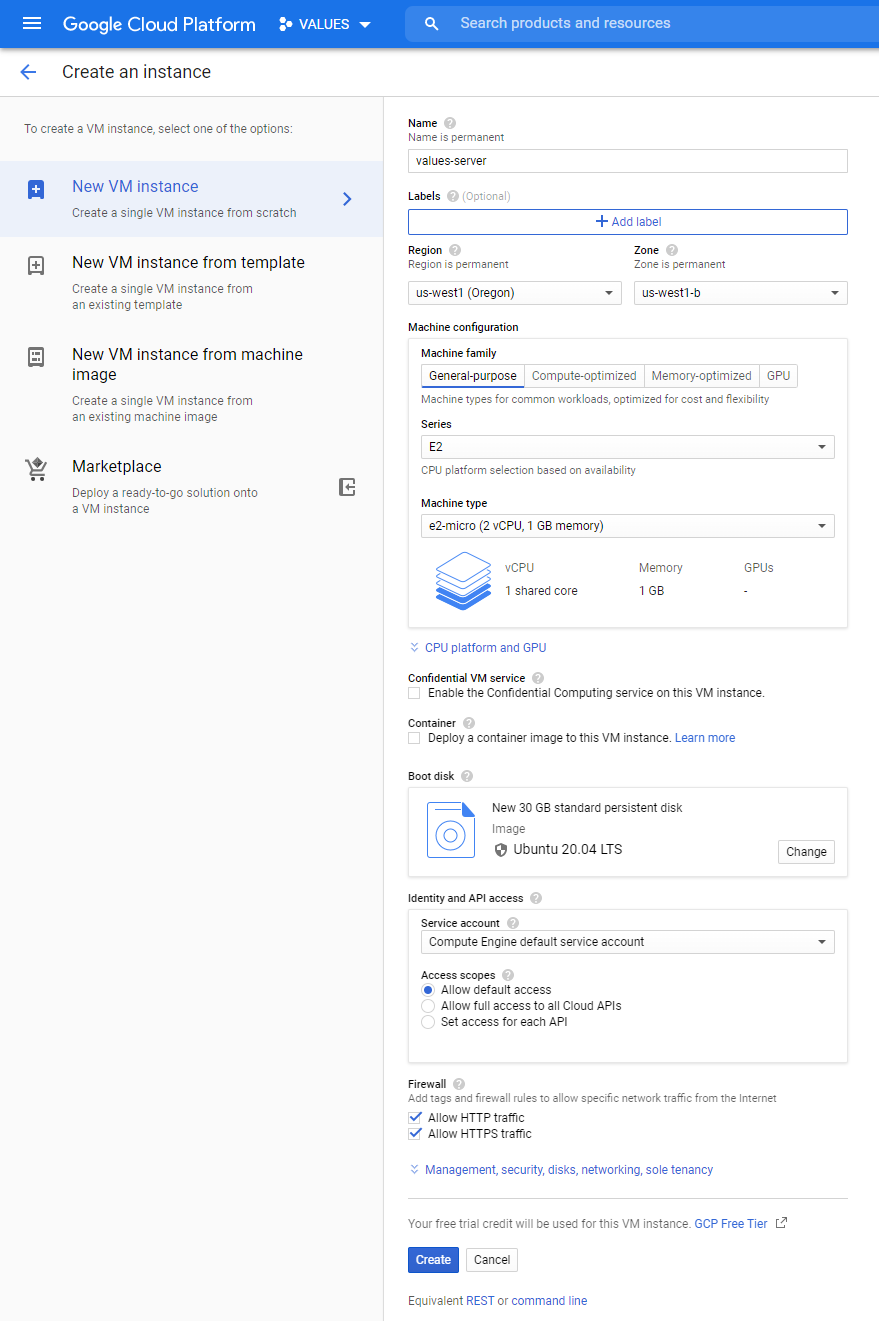
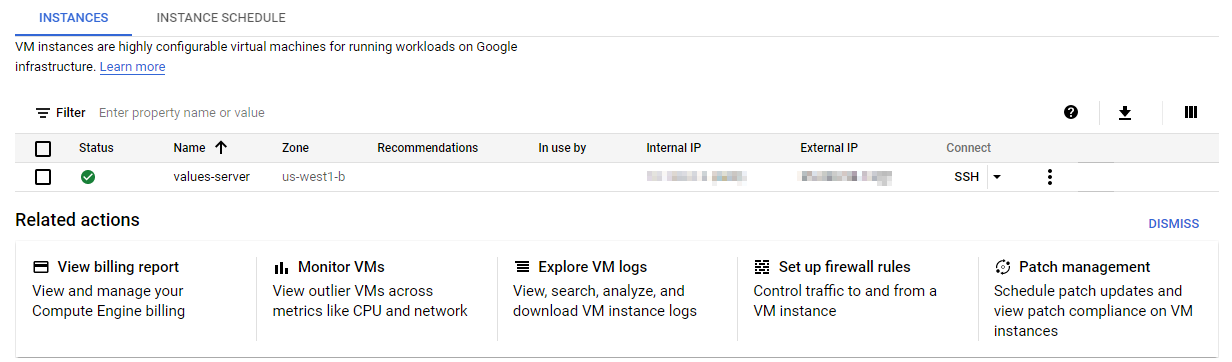
아래 내용을 참고해 웹서버와 데이터베이스를 준비한다.

2021.08.25 - [Linux] - Linux(Ubuntu) Build Your Own Web Server - 리눅스(우분투)로 웹서버 만들기

2021.08.28 - [Linux] - Linux(Ubuntu) MariaDB(MySQL) Server Remote Access - 데이터베이스 원격 접속

(데이터베이스는 로컬로 사용하므로 원격 설정을 할 필요는 없다)


위와 같은 데이터베이스와 테이블을 생성한다.


시간, 온도, 습도 데이터를 적당히 입력한다.


1
2
3
4
5
6
7
8
9
10
11
12
13
14
15
16
17
18
19
20
21
22
23
24
25
26
27
28
29
30
31
32
33
34
35
36
37
38
39
40
41
42
43
44
45
46
47
48
49
50
51
52
53
54
55
56
57
58
59
60
61
62
63
64
65
66
67
68
69
70
71
72
73
74
75
76
77
78
79
80
81
82
83
84
85
86
87
88
89
90
91
92
93
94
95
96
<html>
<head>
    <script type="text/javascript" src="https://www.gstatic.com/charts/loader.js"></script>
    <script src="http://ajax.googleapis.com/ajax/libs/jquery/1.11.2/jquery.min.js"></script>
    <!--
    <script type="text/javascript" src="http://code.jquery.com/jquery-1.11.2.min.js"></script>
    -->
 
    <?php
        // 에러가 발생하면 내용 표시
        error_reporting(E_ALL);
        ini_set('display_errors''1');
 
        $mysql_host = "localhost";
        $mysql_user = "root";
        $mysql_password = "1234";
        $mysql_db = "test_db";
 
        $conn = mysqli_connect($mysql_host$mysql_user$mysql_password$mysql_db);
        if (!$conn) {
            die("Database Connect Error: " . mysqli_connect_error());
        }
            
        //echo "Database Connected.<br><br>";
            
        $sql = "SELECT * FROM test_tb";
        $result = mysqli_query($conn$sql);
        
        if (mysqli_num_rows($result> 0) {
            while ($row = mysqli_fetch_assoc($result)) {
                $data_array[] = $row;
            }
            $chart = json_encode($data_array);
        } else {
            echo "No Data";
        }
        
        //echo $chart;
 
        mysqli_close($conn);
    ?>
 
    <script type="text/javascript">
        google.charts.load('current', { packages: ['corechart''line'] });
        google.charts.setOnLoadCallback(drawChart);
        
        function drawChart() {
            var chart_array = <?php echo $chart; ?>;
            //console.log(JSON.stringify(chart_array))
            var header = ['dt''temp''humid'];
            var row = "";
            var rows = new Array();
            jQuery.each(chart_array, function(index, item) {
                row = [
                    item.dt,
                    Number(item.temp),
                    Number(item.humid)
                ];
                rows.push(row); 
            });
 
            var jsonData = [header].concat(rows);
            var data = new google.visualization.arrayToDataTable(jsonData);
            var options = {
                title: 'Temperaure & Humid',
                hAxis: {
                    title: 'Time'
                },
                series: {
                    0: { targetAxisIndex: 0 },
                    1: { targetAxisIndex: 1 }
                },
                vAxes: {
                    0: {
                        title: 'Temperature',
                        viewWindow: { min: -30, max: 50 }
                    },
                    1: {
                        title: 'Humid',
                        viewWindow: { min: 30, max: 100 }
                    }
                }
                //,
                //curveType: 'function',
                //legend: { position: 'bottom' }
            };
 
            var chart = new google.visualization.LineChart(document.getElementById('chart_div'));
            chart.draw(data, options);
        }
    </script>
</head>
<body>
    <div id="chart_div" style="width: 900px; height: 500px"></div>
</body>
</html>


소스를 입력하고 웹서버에 저장한다.(/var/www/html/index.php)


웹서버에 접속하면 위와 같은 그래프가 표시된다.


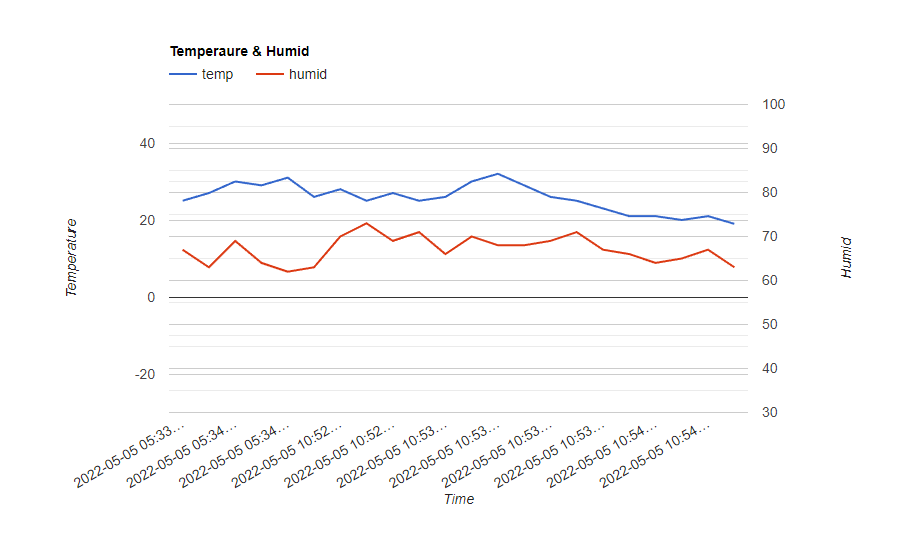
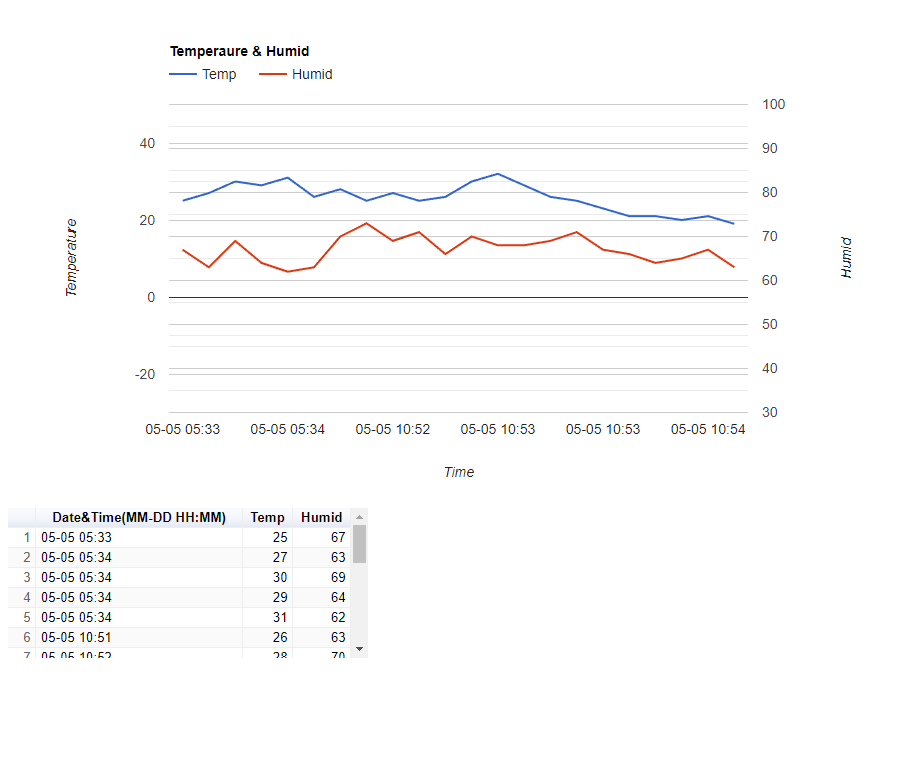
X축 레이블을 좀 더 보기 편하게 바꾸고 테이블 차트도 추가해 보자.


1
2
3
4
5
6
7
8
9
10
11
12
13
14
15
16
17
18
19
20
21
22
23
24
25
26
27
28
29
30
31
32
33
34
35
36
37
38
39
40
41
42
43
44
45
46
47
48
49
50
51
52
53
54
55
56
57
58
59
60
61
62
63
64
65
66
67
68
69
70
71
72
73
74
75
76
77
78
79
80
81
82
83
84
85
86
87
88
89
90
91
92
93
94
95
96
97
98
99
100
101
102
103
104
105
106
107
108
109
110
<html>
<head>
    <script type="text/javascript" src="https://www.gstatic.com/charts/loader.js"></script>
    <script src="http://ajax.googleapis.com/ajax/libs/jquery/1.11.2/jquery.min.js"></script>
    <!--
    <script type="text/javascript" src="http://code.jquery.com/jquery-1.11.2.min.js"></script>
    -->
 
    <?php
        // 에러가 발생하면 내용 표시
        error_reporting(E_ALL);
        ini_set('display_errors''1');
 
        $mysql_host = "localhost";
        $mysql_user = "root";
        $mysql_password = "1234";
        $mysql_db = "test_db";
 
        $conn = mysqli_connect($mysql_host$mysql_user$mysql_password$mysql_db);
        if (!$conn) {
            die("Database Connect Error: " . mysqli_connect_error());
        }
            
        //echo "Database Connected.<br><br>";
            
        $sql = "SELECT * FROM test_tb";
        $result = mysqli_query($conn$sql);
        
        if (mysqli_num_rows($result> 0) {
            while ($row = mysqli_fetch_assoc($result)) {
                $data_array[] = $row;
            }
            $chart = json_encode($data_array);
        } else {
            echo "No Data";
        }
        
        //echo $chart;
 
        mysqli_close($conn);
    ?>
 
    <script type="text/javascript">
        google.charts.load('current', { packages: ['corechart''line'] });
        google.charts.load('current', { packages: ['table'] });
        google.charts.setOnLoadCallback(drawChart);
        
        function drawChart() {
            var chart_array = <?php echo $chart; ?>;
            //console.log(JSON.stringify(chart_array))
            var header = ['Date&Time(MM-DD HH:MM)''Temp''Humid'];
            var row = "";
            var rows = new Array();
            jQuery.each(chart_array, function(index, item) {
                row = [
                    item.dt.substr(511),  // 너무 긴 날짜 및 시간을 짧게 추출
                    Number(item.temp),
                    Number(item.humid)
                ];
                rows.push(row); 
            });
 
            var jsonData = [header].concat(rows);
            var data = new google.visualization.arrayToDataTable(jsonData);
 
            var lineChartOptions = {
                title: 'Temperaure & Humid',
                hAxis: {
                    title: 'Time',
                    showTextEvery: 4    // X축 레이블이 너무 많아 보기 힘드므로 4개마다 하나씩 표시
                },
                series: {
                    0: { targetAxisIndex: 0 },
                    1: { targetAxisIndex: 1 }
                },
                vAxes: {
                    0: {
                        title: 'Temperature',
                        viewWindow: { min: -30, max: 50 }
                    },
                    1: {
                        title: 'Humid',
                        viewWindow: { min: 30, max: 100 }
                    }
                }
                //,
                //curveType: 'function',
                //legend: { position: 'bottom' }
            };
 
            var lineChart = new google.visualization.LineChart(document.getElementById('lineChart_div'));
            lineChart.draw(data, lineChartOptions);
 
            // 테이블 차트
            var tableChartOptions = {
                showRowNumber: true,
                width: '40%',
                height: '20%'
            }
 
            var tableChart = new google.visualization.Table(document.getElementById('tableChart_div'));
            tableChart.draw(data, tableChartOptions);
        }
    </script>
</head>
<body>
    <div id="lineChart_div" style="width: 900px; height: 500px"></div>
    <div id="tableChart_div"></div>
</body>
</html>


소스를 수정하고 웹서버에 저장한다.(/var/www/html/index.php)


웹서버에 접속하면 위와 같은 그래프와 차트가 표시된다.


※ 참고

2022.05.05 - [Web Development] - Google Chart - 구글 차트 1

반응형
Posted by J-sean
:
반응형

구글 차트를 이용해 웹페이지에 그래프(Dual-Y Chart)를 그려보자.


서버가 필요하다면 아래 링크를 참고해 서버를 만든다.

2021.08.25 - [Linux] - Linux(Ubuntu) Build Your Own Web Server - 리눅스(우분투)로 웹서버 만들기


1
2
3
4
5
6
7
8
9
10
11
12
13
14
15
16
17
18
19
20
21
22
23
24
25
26
27
28
29
30
31
32
33
34
35
36
37
38
39
40
41
42
43
44
45
46
47
48
49
50
51
52
53
54
55
56
57
58
59
60
61
62
<html>
<head>
    <script type="text/javascript" src="https://www.gstatic.com/charts/loader.js"></script>
    <script type="text/javascript">
        google.charts.load('current', { packages: ['corechart''line'] });
        google.charts.setOnLoadCallback(drawChart);
 
        function drawChart() {
            var data = new google.visualization.DataTable();
            data.addColumn('datetime''Time');
            data.addColumn('number''Temperature');
            data.addColumn('number''Humid');
 
            data.addRows([
                // 00: 1월, 01: 2월, 02: 3월...
                [new Date(202203011130), 2570],
                [new Date(202203021130), 2672],
                [new Date(202203031130), 2775],
                [new Date(202203041130), 2977],
                [new Date(202203051130), 2474],
                [new Date(202203061130), 2671],
                [new Date(202203071130), 2974],
                [new Date(202203081130), 3172],
                [new Date(202203091130), 3369],
                [new Date(202203101130), 2975],
                [new Date(202203111130), 3272],
                [new Date(202203121130), 3171]
            ]);
 
            var options = {
                title: 'Temperaure & Humid',
                hAxis: {
                    title: 'Time'
                },
                series: {
                    0: { targetAxisIndex: 0 },
                    1: { targetAxisIndex: 1 }
                },
                vAxes: {
                    0: {
                        title: 'Temperature',
                        viewWindow: { min: -30, max: 50 }
                    },
                    1: {
                        title: 'Humid',
                        viewWindow: { min: 30, max: 100 }
                    }
                }
                //,
                //curveType: 'function',
                //legend: { position: 'bottom' }
            };
 
            var chart = new google.visualization.LineChart(document.getElementById('chart_div'));
            chart.draw(data, options);
        }
    </script>
</head>
<body>
    <div id="chart_div" style="width: 900px; height: 500px"></div>
</body>
</html>


HTML소스를 입력하고 저장한다.


인터넷 브라우저로 열어보면 그래프가 나타난다.


※ 참고

Google Charts

반응형
Posted by J-sean
:
반응형

구글 안드로이드 맵 SDK를 사용해 보자.


Google Play services가 설치되어 있지 않다면 설치한다.


play-services-maps를 추가한다.


AndroidManifest.xml에 API KEY와 GMS(Google Mobile Services) 버전 확인하는 메타 데이터를 추가한다.


레이아웃에 fragment를 추가한다.


1
2
3
4
5
6
7
8
9
10
11
12
13
14
15
16
17
18
19
20
21
22
23
24
25
26
27
28
29
30
31
32
33
34
package com.example.myapplication;
 
import androidx.annotation.NonNull;
import androidx.appcompat.app.AppCompatActivity;
 
import android.os.Bundle;
 
import com.google.android.gms.maps.CameraUpdateFactory;
import com.google.android.gms.maps.GoogleMap;
import com.google.android.gms.maps.OnMapReadyCallback;
import com.google.android.gms.maps.SupportMapFragment;
import com.google.android.gms.maps.model.LatLng;
import com.google.android.gms.maps.model.MarkerOptions;
 
public class MainActivity extends AppCompatActivity implements OnMapReadyCallback {
 
    @Override
    protected void onCreate(Bundle savedInstanceState) {
        super.onCreate(savedInstanceState);
        setContentView(R.layout.activity_main);
 
        SupportMapFragment mapFragment = (SupportMapFragment) getSupportFragmentManager()
                .findFragmentById(R.id.map);
        mapFragment.getMapAsync(this);
    }
 
    @Override
    public void onMapReady(@NonNull GoogleMap googleMap) {
        LatLng curPosition = new LatLng(37.3850143127.1234308);
 
        googleMap.addMarker(new MarkerOptions().position(curPosition).title("Marker"));
        googleMap.moveCamera(CameraUpdateFactory.newLatLngZoom(curPosition, 16));
    }
}


소스를 입력하고 빌드한다.


지정한 위치에 마커가 표시되고 카메라가 이동한다.

※ 참고

Android용 Maps SDK 개요


반응형
Posted by J-sean
:
반응형

C# WinForm 으로 구글 클라우드 비전 API를 이용해 Detect localized objects in a single image 를 진행해 보자. 아래 링크를 참고해 기본 준비를 한다.

2022.02.11 - [C#] - C# Google Cloud Vision API - 구글 클라우드 비전 API 2


1
2
3
4
5
6
7
8
9
10
11
12
13
14
15
16
17
18
19
20
21
22
23
24
25
26
27
28
29
30
31
32
33
34
35
36
37
38
39
40
41
42
43
44
45
46
47
48
49
50
51
52
53
54
55
56
57
58
59
60
61
62
63
64
65
66
67
68
69
70
71
72
73
74
75
76
77
78
79
80
81
82
83
84
85
86
87
88
89
90
91
92
93
using System;
using System.Collections.Generic;
using System.ComponentModel;
using System.Data;
using System.Drawing;
using System.Linq;
using System.Text;
using System.Threading.Tasks;
using System.Windows.Forms;
 
using Google.Cloud.Vision.V1;
 
namespace WindowsFormsApp1
{
    public partial class Form1 : Form
    {
        ImageAnnotatorClient client;
 
        public Form1()
        {
            InitializeComponent();
 
            try
            {
                client = new ImageAnnotatorClientBuilder
                {
                    CredentialsPath = "your_credentials.json"
                }.Build();
            }
            catch (Exception exc)
            {
                MessageBox.Show(exc.Message);
                Close();
            }
        }
 
        private void button1_Click(object sender, EventArgs e)
        {
            try
            {
                System.Drawing.Image systemImage;
 
                OpenFileDialog dlg = new OpenFileDialog();
                if (dlg.ShowDialog() == DialogResult.OK)
                {
                    systemImage = System.Drawing.Image.FromFile(dlg.FileName);
                    pictureBox1.Image = systemImage;
 
                    pictureBox1.Refresh();
 
                    Graphics graphics = pictureBox1.CreateGraphics();
 
                    Google.Cloud.Vision.V1.Image visionImage = Google.Cloud.Vision.V1.Image.FromFile(dlg.FileName);
 
                    IReadOnlyList<LocalizedObjectAnnotation> annotations = client.DetectLocalizedObjects(visionImage);
                    foreach (LocalizedObjectAnnotation annotation in annotations)
                    {
                        Google.Protobuf.Collections.RepeatedField<NormalizedVertex> normalizedVertices =
                            annotation.BoundingPoly.NormalizedVertices;
 
                        int imageWidth = systemImage.Width;
                        int imageHeight = systemImage.Height;
                        // Google.Cloud.Vision.V1.Image 는 Width, Height 필드가 없다.
 
                        Rectangle rectangle = new Rectangle(
                            (int)(normalizedVertices[0].X * imageWidth),
                            (int)(normalizedVertices[0].Y * imageHeight),
                            (int)((normalizedVertices[2].X - normalizedVertices[0].X) * imageWidth),
                            (int)((normalizedVertices[2].Y - normalizedVertices[0].Y) * imageHeight)
                            );
                        // BoundingPoly.NormalizedVertices 는 0~1의 범위를 가지는 값이다.
 
                        StringFormat stringFormat = new StringFormat
                        {
                            Alignment = StringAlignment.Center,
                            LineAlignment = StringAlignment.Center
                        };
 
                        graphics.DrawRectangle(System.Drawing.Pens.Red, rectangle);
                        graphics.DrawString($"Name: {annotation.Name}\n ID: {annotation.Mid}\n Score: {annotation.Score}",
                            Font, Brushes.Red, rectangle, stringFormat);
                    }
 
                    graphics.Dispose();
                }
            }
            catch (Exception exc)
            {
                MessageBox.Show(exc.Message);
            }
        }
    }
}


소스를 입력하고 빌드한다.


반응형
Posted by J-sean
:
반응형

C# WinForm 으로 구글 클라우드 비전 API 결과를 확인해 보자. 아래 링크를 참고해 기본적인 구글 클라우드 비전 API 사용 준비를 한다.

2022.02.11 - [C#] - C# Google Cloud Vision API - 구글 클라우드 비전 API 1


Visual Studio - NuGet Package Manager에서 Google.Cloud.Vision.V1을 설치한다.


PictureBox, Button을 적당히 배치한다.


1
2
3
4
5
6
7
8
9
10
11
12
13
14
15
16
17
18
19
20
21
22
23
24
25
26
27
28
29
30
31
32
33
34
35
36
37
38
39
40
41
42
43
44
45
46
47
48
49
50
51
52
53
54
55
56
57
58
59
60
61
62
63
64
65
66
67
68
69
70
71
72
73
74
75
76
77
78
79
80
81
82
83
84
85
86
87
88
89
90
91
using System;
using System.Collections.Generic;
using System.ComponentModel;
using System.Data;
using System.Drawing;
using System.Linq;
using System.Text;
using System.Threading.Tasks;
using System.Windows.Forms;
 
using System.IO;
using Google.Cloud.Vision.V1;
 
namespace WindowsFormsApp1
{
    public partial class Form1 : Form
    {
        ImageAnnotatorClient client;
 
        public Form1()
        {
            InitializeComponent();
 
            try
            {                
                client = new ImageAnnotatorClientBuilder
                {
                    CredentialsPath = "./values-324913-58dd97f8b8ec.json"                    
                }.Build();
            }
            catch (Exception exc)
            {
                MessageBox.Show(exc.Message);
                Close();
            }
        }
 
        private void button1_Click(object sender, EventArgs e)
        {
            try
            {
                System.Drawing.Image systemImage;
 
                OpenFileDialog dlg = new OpenFileDialog();
                if (dlg.ShowDialog() == DialogResult.OK)
                {
                    systemImage = System.Drawing.Image.FromFile(dlg.FileName);
                    pictureBox1.Image = systemImage;
 
                    pictureBox1.Refresh();
                    //Forces the control to invalidate its client area and immediately redraw itself and any child controls.
                    // 미리 Refresh()를 호출하지 않으면 아래 얼굴 영역 사각형, 신뢰도 텍스트 출력이 보이지 않는다.
 
                    Graphics graphics = pictureBox1.CreateGraphics();
 
                    Google.Cloud.Vision.V1.Image visionImage = Google.Cloud.Vision.V1.Image.FromFile(dlg.FileName);
                    //MemoryStream memoryStream = new MemoryStream();
                    //pictureBox1.Image.Save(memoryStream, System.Drawing.Imaging.ImageFormat.Png);
                    //Google.Cloud.Vision.V1.Image visionImage = Google.Cloud.Vision.V1.Image.FromBytes(memoryStream.ToArray());                    
                    // Google.Cloud.Vision.V1.Image와 System.Drawing.Image는 서로 호환되지 않는다.
                    
                    IReadOnlyList<FaceAnnotation> result = client.DetectFaces(visionImage);
                    foreach (FaceAnnotation face in result)
                    {
                        Google.Protobuf.Collections.RepeatedField<Vertex> vertices = face.BoundingPoly.Vertices;
                        
                        Rectangle rectangle = new Rectangle(vertices[0].X, vertices[0].Y, vertices[2].X - vertices[0].X,
                            vertices[2].Y - vertices[0].Y);
                        // 얼굴 영역 (vertices[0]: 좌상단, vertices[1]:우상단, vertices[2]:우하단, vertices[3]:좌하단)
                        StringFormat stringFormat = new StringFormat
                        {
                            Alignment = StringAlignment.Center,
                            LineAlignment = StringAlignment.Center
                        };
                        // 신뢰도 문자열 센터 정렬
 
                        graphics.DrawRectangle(System.Drawing.Pens.Red, rectangle);
                        graphics.DrawString($"Confidence: {(int)(face.DetectionConfidence * 100)}%", Font,
                            Brushes.Red, rectangle, stringFormat);
                    }
 
                    graphics.Dispose();
                }
            }
            catch (Exception exc)
            {
                MessageBox.Show(exc.Message);
            }
        }
    }
}


소스를 입력하고 빌드한다.


버튼을 클릭하고 이미지 파일을 불러온다.


불러온 이미지의 얼굴 영역에 사각형과 신뢰도가 표시된다.


얼굴 이미지가 잘리거나 명확하지 않으면 제대로 검출되지 않는다.


반응형
Posted by J-sean
:
반응형

C#에서 구글 클라우드 비전 API를 사용해 보자.


Google Could Platform - APIs&amp;amp;amp;Services 에서 Cloud Vision API를 활성화(Enable)한다.


Service account key를 생성하고 JSON파일로 다운로드한다.


Visual Studio - NuGet Package Manager에서 Google.Cloud.Vision.V1을 설치한다.


1
2
3
4
5
6
7
8
9
10
11
12
13
14
15
16
17
18
19
20
21
22
23
24
25
26
27
28
29
30
31
32
33
34
35
36
37
38
39
40
41
using System;
using System.Collections.Generic;
using System.Linq;
using System.Text;
using System.Threading.Tasks;
 
using System.IO;
using Google.Cloud.Vision.V1;
 
namespace ConsoleApp1
{
    class Program
    {
        static void Main(string[] args)
        {
            try
            {
                Image image = Image.FromFile("./barbara.png");
                string credentialsString = File.ReadAllText("./your_jsoncredentials.json");
 
                ImageAnnotatorClient client = new ImageAnnotatorClientBuilder
                {
                    JsonCredentials = credentialsString
                    //CredentialsPath = "./your_jsoncredentials.json"
                    // 간단히 CredentialsPath에 서비스 계정 키(json) 파일을 직접 대입해도 된다.
                }.Build();
 
                IReadOnlyList<FaceAnnotation> result = client.DetectFaces(image);
                foreach (FaceAnnotation face in result)
                {
                    string poly = string.Join(" - ", face.BoundingPoly.Vertices.Select(v => $"({v.X}, {v.Y})"));
                    Console.WriteLine($"Confidence: {(int)(face.DetectionConfidence * 100)}%; BoundingPoly: {poly}");
                }
            }
            catch (Exception e)
            {
                Console.WriteLine(e.Message);
            }
        }
    }
}


소스를 입력하고 빌드한다.


분석 이미지


분석 이미지의 얼굴 좌표와 신뢰도가 함께 표시된다.


1
2
3
4
5
6
7
8
9
10
11
12
13
14
15
16
17
18
19
20
21
22
23
24
25
26
27
28
29
30
31
32
33
34
35
36
37
38
39
40
41
42
43
44
45
46
47
48
49
50
51
52
53
54
55
56
57
58
59
60
61
62
63
64
65
66
using System;
using System.Collections.Generic;
using System.Linq;
using System.Text;
using System.Threading.Tasks;
 
using Google.Cloud.Vision.V1;
using Newtonsoft.Json;
 
namespace ConsoleApp1
{
    class Program
    {
        static void Main(string[] args)
        {
            try
            {
                Image image = Image.FromFile("./barbara.png");
                Credentials credentials = new Credentials
                {
                    type = "your_type",
                    project_id = "your_project_id",
                    private_key_id = "your_key_id",
                    private_key = "-----BEGIN PRIVATE KEY-----your_key-----END PRIVATE KEY-----\n",
                    client_email = "your_email",
                    client_id = "your_client_id",
                    auth_uri = "your_auth_uri",
                    token_uri = "your_token_uri",
                    auth_provider_x509_cert_url = "your_auth_cert_url",
                    client_x509_cert_url = "your_client_cert_url"
                };
 
                ImageAnnotatorClient client = new ImageAnnotatorClientBuilder
                {
                    JsonCredentials = JsonConvert.SerializeObject(credentials)
 
                }.Build();
 
                IReadOnlyList<FaceAnnotation> result = client.DetectFaces(image);
                foreach (FaceAnnotation face in result)
                {
                    string poly = string.Join(" - ", face.BoundingPoly.Vertices.Select(v => $"({v.X}, {v.Y})"));
                    Console.WriteLine($"Confidence: {(int)(face.DetectionConfidence * 100)}%; BoundingPoly: {poly}");
                }
            }
            catch (Exception e)
            {
                Console.WriteLine(e.Message);
            }
        }
    }
 
    class Credentials
    {
        public string type;
        public string project_id;
        public string private_key_id;
        public string private_key;
        public string client_email;
        public string client_id;
        public string auth_uri;
        public string token_uri;
        public string auth_provider_x509_cert_url;
        public string client_x509_cert_url;
    }
}


위 소스처럼 서비스 계정 키(json)의 내용을 코드에 직접 삽입 할 수도 있다.


※ 참고

Google.Cloud.Vision.V1


반응형
Posted by J-sean
:
반응형

Google Cloud Platform(GCP) 의 무료 프로그램을 이용하면 간단한 리눅스 서버를 만들 수 있다.


2019.10.11 - [Linux] - Google Cloud Platform Always Free Linux Web Server 구글 클라우드 플랫폼으로 무료 리눅스 웹서버 만들기


위 링크의 예전 방법과 비슷하지만 무료 프로그램 조건이 약간 변경 되었다.


GCP - Compute Engine - VM instances를 클릭한다.


CREATE INSTANCE를 클릭한다.


우선 무료 Compute Engine의 조건을 확인해 보자.

Google Cloud 무료 프로그램


무료 프로그램 조건에 맞게 설정하고 Create 버튼을 클릭한다.

  • Name: 원하는 이름으로 지정한다.
  • Region: 아래 목록중 하나를 선택한다.
    - Oregon: us-west1
    - Iowa: us-central1
    - South Carolina: us-east1
  • Machine family: General-purpose
  • Series: E2
  • Machine type: e2-micro (2 vCPU, 1 GB memory)
  • Boot disk: standard persistent disk로 최대 30GB 까지 선택 가능.
  • Firewall: 웹서버를 설치한다면 Allow HTTP/HTTPS traffic을 선택한다.


Instance가 생성 되었다. Connect - SSH 를 클릭한다.


생성된 Instance에 연결 되었다.


반응형
Posted by J-sean
:
반응형

프로그래머도 아니면서 사람들의 관심이 거의 없는 프로그래밍이라는 주제로 블로그를 시작하고 꽤나 오랜 시간이 지나 구글 애드센스 승인까지 받았다. 음식, 패션 등의 주제로 시작했다면 더 빨리 받았을텐데.. 역시 주제를 잘 잡아야 한다.


확인 기준액이라는 $10를 넘어 PIN 번호를 요청하고 기다림..

4주를 기다렸지만 안온다.


다시 요청, 4주 기다림..

안온다.


주소를 바꾸면 될까 해서 회사 주소로 바꾸고 다시 요청, 4주 기다림..

안온다.


이젠 블로그에서 광고가 중단되었고 짜증이 밀려 왔다.

그냥 이메일로 보내주던가.. 대체 왜 느리고 오지도 않는 우편을 보내는 건지..


결국 PIN이 오지 않으면 어떻게 해야하는지 검색해보고 필요한 서류를 알아 두었다.

신분증 사본, 은행 입출금 내역서.. 아.. 귀찮네..


이것 때문에 연차까지 내서 은행을 가야 하나? 라는 생각이 들었고 언제 한 번 시간내서 갔다 와야지.. 하던 중 회사 우편물 사이에 뭔가 심상치 않은 엽서 같은걸 발견!!


드디어 받았다. 애드센스 PIN 번호.

아마 회사 주소로 바꾸고 나서야 제대로 도착한거 같은데.. 대체 왜 집주소로는 2번이나 오지 않았던건지 알 수가 없다.

나중에 유튜브 실버 버튼도 집으로는 안오는거 아닐까? 하는 너무 성급한 걱정이 들기 시작했다.


뭐 어쨌든.. 편지를 열어 PIN 번호를 확인하고 입력했다.


PIN 번호 확인이 안되었다는 메세지가 사라지고 다시 광고가 나오기 시작했다.

일주일 넘게 광고가 중단되었던 바람에 가뜩이나 클릭도 없는 블로그 수익은 바닥을 치고..


확인해 보니 대부분의 글들이 광고가 제대로 표시 되지 않는다.. 그냥 빈 공간으로 표시.. 후..


글 수정을 누르고 다시 저장을 하면 제대로 광고가 표시 되기도 하고.. 어떤 글은 또 안되기도 하고..

검색해 보니 이런 문제를 겪는 사람들이 꽤 있는 듯.. 블로그 스킨에 문제가 있는 건지, 아니면 다른 뭔가 문제가 있는건지 대체 알 수 가 없다.


하여간 맘에 안드는 구글 애드센스다.


반응형
Posted by J-sean
: