[vLLM] WSL에서 vLLM 서버 실행하고 사용하기
AI, ML, DL 2026. 6. 21. 13:59 |아래 링크와 같이 WSL에 설치한 vLLM 서버를 실행하고 사용해 보자.
2026.06.19 - [AI, ML, DL] - [vLLM] WSL 에서 vLLM 설치 및 간단한 실행

■ 서버 실행하기 (Foreground에서 실행된다)
VLLM_USE_FLASHINFER_SAMPLER=0 python3 -m vllhttp://m.entrypoints.openai.api_server --model LGAI-EXAONE/EXAONE-Deep-2.4B-AWQ --trust_remote_code True --gpu_memory_utilization=0.7
■ 서버 실행하기 (Background에서 실행되고 vllm.log 파일에 로그가 기록된다)
VLLM_USE_FLASHINFER_SAMPLER=0 python3 -m vllhttp://m.entrypoints.openai.api_server --model LGAI-EXAONE/EXAONE-Deep-2.4B-AWQ --trust_remote_code True --gpu_memory_utilization=0.7 > vllm.log 2>&1 &
VLLM_USE_FLASHINFER_SAMPLER=0은 vLLM이 다음 토큰을 선택(샘플링)할 때 FlashInfer 라이브러리의 고속 커널을 사용하지 않고, PyTorch/Triton 기반의 기본 내장 샘플러를 사용하도록 강제하는 환경 변수 설정이다. 내 시스템에선 이 옵션 없이는 실행할 수 없었다.
■ 백그라운드에서 동작중인 서버 프로세스 확인 (백그라운드에서 동작하는 프로세스 중 vllm이라는 문자열과 VLLM이라는 문자열을 검색한다)
ps -ef | grep -E "vllm|VLLM"
■ 백그라운드 서버 종료
pkill -f vllhttp://m.entrypoints.openai.api_server
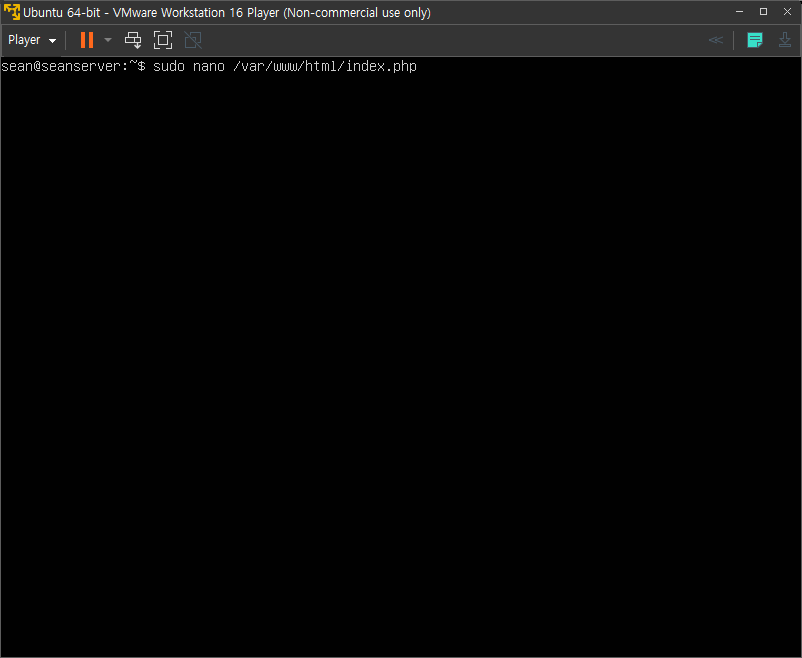
동작중인 서버를 이용해보자. 아래 코드를 작성하고 실행한다.
from openai import OpenAI
# vLLM 서버 주소 설정 (기본 포트 8000)
client = OpenAI(
base_url="http://localhost:8000/v1",
api_key="vllm-token" # api_key는 아무 문자열이나 넣어도 된다.
)
# 단발성 답변 받기 (General Request)
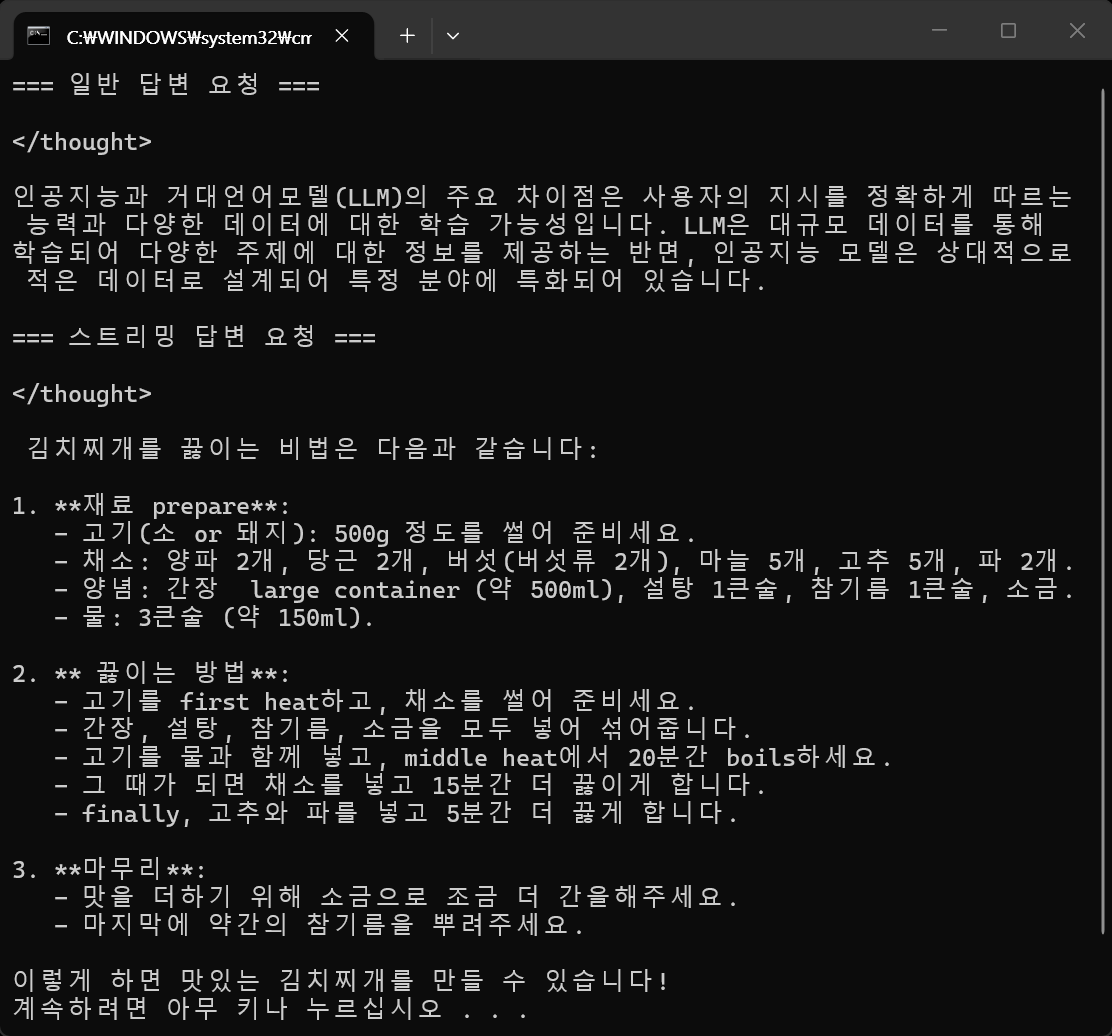
print("=== 일반 답변 요청 ===")
response = client.chat.completions.create(
model="LGAI-EXAONE/EXAONE-Deep-2.4B-AWQ", # 동작중인 서버의 모델 이름과 일치해야 한다.
messages=[
{"role": "system", "content": "당신은 친절한 AI 도우미입니다."},
{"role": "user", "content": "인공지능과 거대언어모델(LLM)의 차이점을 한 문장으로 설명해줘."}
],
temperature=0.2,
top_p=0.95,
max_tokens=1024
)
print(response.choices[0].message.content)
print()
# 실시간 스트리밍 답변 받기 (Streaming Request)
print("=== 스트리밍 답변 요청 ===")
stream = client.chat.completions.create(
model="LGAI-EXAONE/EXAONE-Deep-2.4B-AWQ",
messages=[
{"role": "system", "content": "당신은 친절한 AI 요리사 도우미 입니다."},
{"role": "user", "content": "맛있는 김치찌개를 끓이는 비법을 짧게 알려줘."}
],
temperature=0.2,
top_p=0.95,
max_tokens=1024,
stream=True, # 스트리밍 활성화
)
for chunk in stream:
if chunk.choices[0].delta.content is not None:
print(chunk.choices[0].delta.content, end="", flush=True)
print()
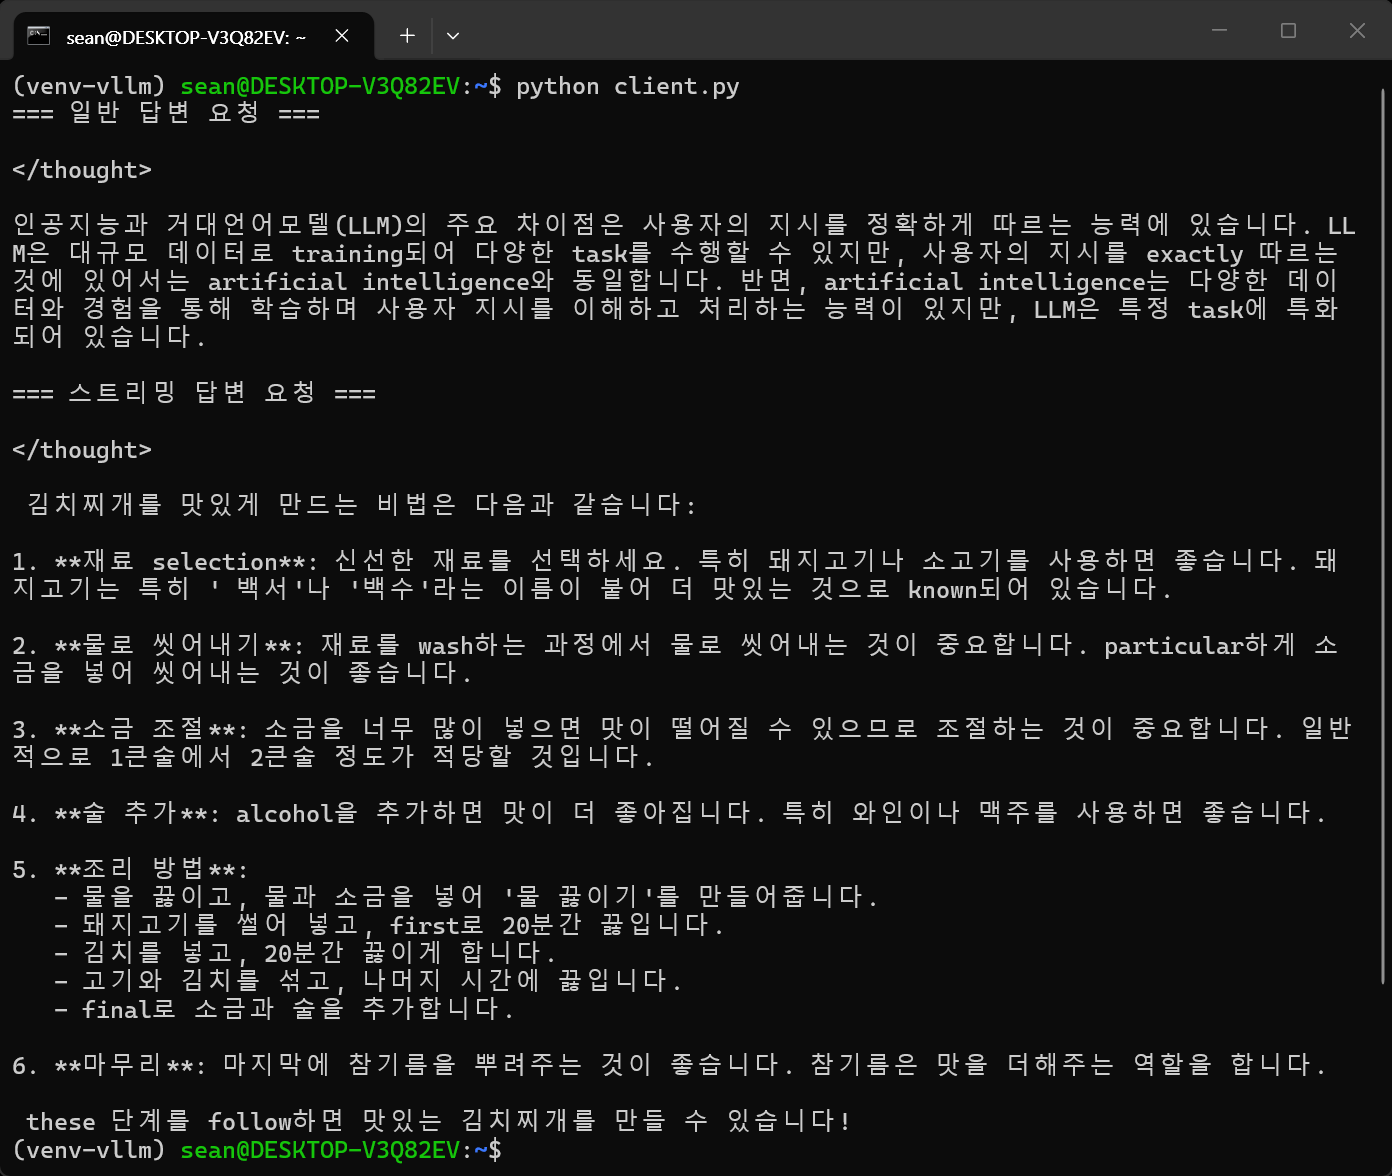
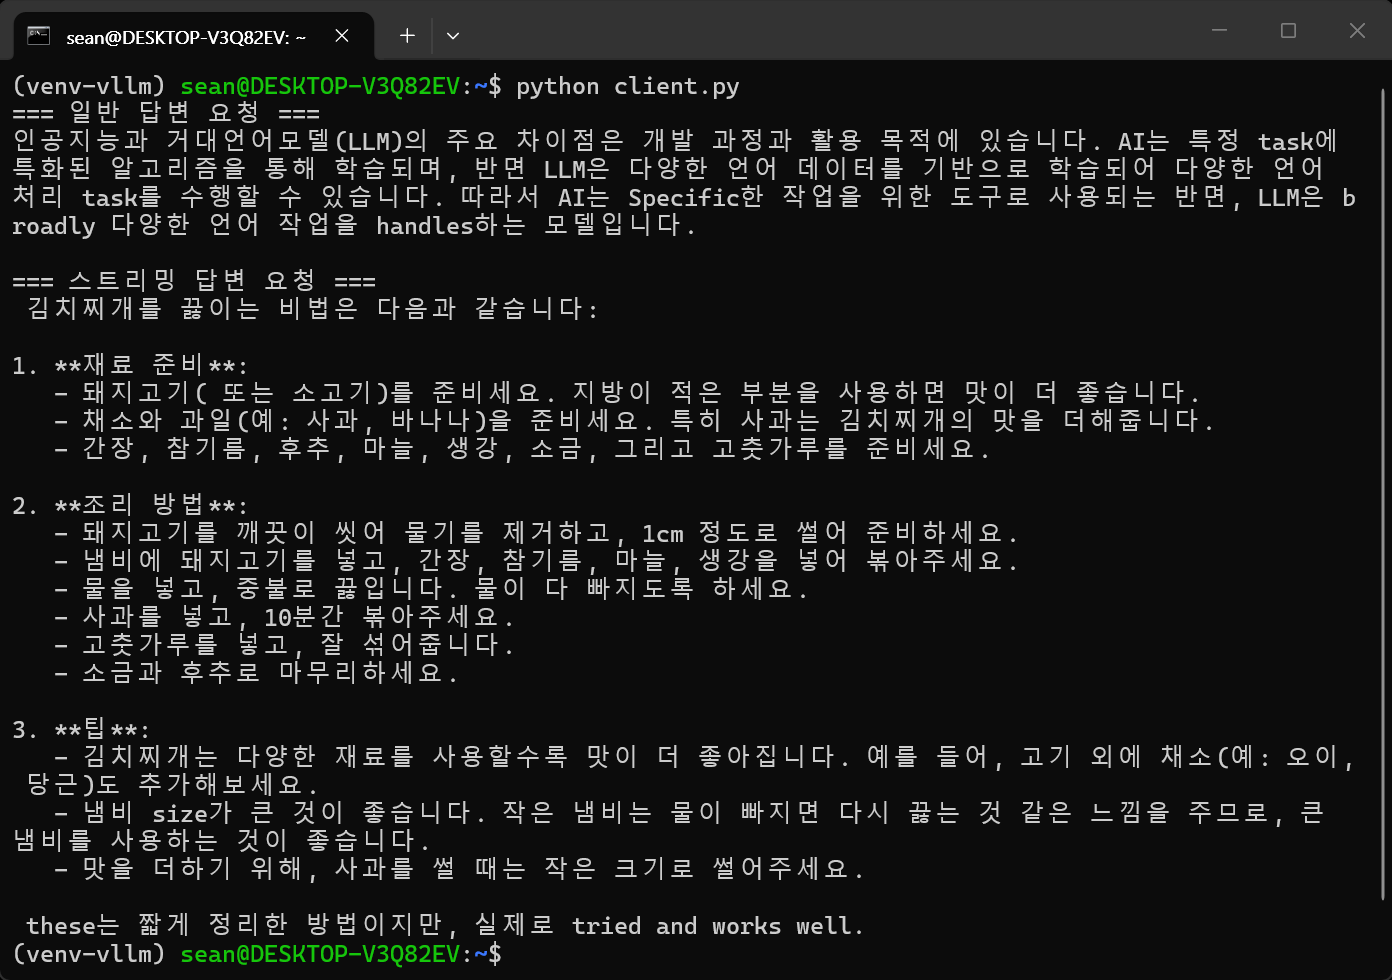
불필요한 태그를 제거해 보자.
from openai import OpenAI

# vLLM 서버 주소 설정 (기본 포트 8000)
client = OpenAI(
    base_url="http://localhost:8000/v1",
    api_key="vllm-token" # api_key는 아무 문자열이나 넣어도 된다.
)

# 단발성 답변 받기 (General Request)
print("=== 일반 답변 요청 ===")
response = client.chat.completions.create(
    model="LGAI-EXAONE/EXAONE-Deep-2.4B-AWQ",  # 동작중인 서버의 모델 이름과 일치해야 한다.
    messages=[
        {"role": "system", "content": "당신은 친절한 AI 도우미입니다."},
        {"role": "user", "content": "인공지능과 거대언어모델(LLM)의 차이점을 한 문장으로 설명해줘."}
    ],
    temperature=0.2,
    top_p=0.95,
    max_tokens=1024
)

#print(response.choices[0].message.content) # 태그 포함 답변 출력
content = response.choices[0].message.content

# </thought> 태그가 포함되어 있다면 분할 처리
if "</thought>" in content:
    # thought_process: 모델이 생각한 과정 (필요시 사용)
    # final_answer: 사용자가 원하는 최종 답변
    thought_process, final_answer = content.split("</thought>", 1)
    #print("=== [AI의 생각 과정] ===")
    #print(thought_process.replace("<thought>", "").strip()) # 시작 태그가 남아있다면 제거
    print(final_answer.strip())
else:
    # 태그가 없는 일반적인 경우 그대로 출력
    print(content)

print()

# 실시간 스트리밍 답변 받기 (Streaming Request)
print("=== 스트리밍 답변 요청 ===")
stream = client.chat.completions.create(
    model="LGAI-EXAONE/EXAONE-Deep-2.4B-AWQ",
    messages=[
        {"role": "system", "content": "당신은 친절한 AI 요리사 도우미 입니다."},
        {"role": "user", "content": "맛있는 김치찌개를 끓이는 비법을 짧게 알려줘."}
    ],
    temperature=0.2,
    top_p=0.95,
    max_tokens=1024,
    stream=True, # 스트리밍 활성화
)

# 실시간 문자열에서 불필요한 </thought> 태그 처리를 위한 변수 선언
full_text = ""
has_passed_thought = False

for chunk in stream:
    if chunk.choices[0].delta.content is not None:
        #print(chunk.choices[0].delta.content, end="", flush=True) # 태그 포함 답변 출력

        token = chunk.choices[0].delta.content
        full_text += token  # 들어오는 토큰을 전체 버퍼에 누적

        # </thought> 태그가 지나갔는지 확인
        if not has_passed_thought:
            if "</thought>" in full_text:
                # 태그가 끝나는 지점을 찾아 그 이후의 텍스트만 추출
                _, final_start_text = full_text.split("</thought>", 1)
                has_passed_thought = True

                # 태그 뒤에 공백이나 줄바꿈이 있다면 깔끔하게 지우고 첫 출력
                first_output = final_start_text.lstrip()
                if first_output:
                    print(first_output, end="", flush=True)
            else:
                # 아직 </thought> 태그가 나오기 전(생각 중)이라면 화면에 출력하지 않고 건너뛴다.
                continue
        else:
            # 만약 앞서 출력된 내용이 아직 아무것도 없다면 (sys.stdout이 비어있음)
            # 다음에 들어오는 토큰들도 첫 글자가 나올 때까지 앞쪽 공백/줄바꿈을 계속 지워준다.
            if not full_text.split("</thought>", 1)[1].lstrip():
                # 여전히 공백이나 줄바꿈만 들어오는 상태이므로 출력하지 않고 스킵.
                continue

            # 글자가 들어오기 시작하면, 그 시점의 토큰부터 그대로 출력.
            # (단, 공백이 섞여 들어왔을 수 있으므로 첫 진입 토큰만 lstrip 처리)
            if len(full_text.split("</thought>", 1)[1].lstrip()) == len(token):
                print(token.lstrip(), end="", flush=True)
            else:
                print(token, end="", flush=True)

print()
또한 WSL에 서버를 실행한 상태에서 네이티브 윈도우에서도 위와 동일한 코드로 LLM을 사용할 수 있다.
아니면 WSL에서 hostname -I 명령으로 확인한 IP 주소값을 base_url에 넣어도 된다.
from openai import OpenAI

# vLLM 서버 주소 설정 (기본 포트 8000)
client = OpenAI(
    base_url="http://localhost:8000/v1",
    #base_url="http://172.21.167.101:8000/v1",
    api_key="vllm-token" # api_key는 아무 문자열이나 넣어도 된다.
)

# 단발성 답변 받기 (General Request)
print("=== 일반 답변 요청 ===")
response = client.chat.completions.create(
    model="LGAI-EXAONE/EXAONE-Deep-2.4B-AWQ",  # 동작중인 서버의 모델 이름과 일치해야 한다.
    messages=[
        {"role": "system", "content": "당신은 친절한 AI 도우미입니다."},
        {"role": "user", "content": "인공지능과 거대언어모델(LLM)의 차이점을 한 문장으로 설명해줘."}
    ],
    temperature=0.2,
    top_p=0.95,
    max_tokens=1024
)

print(response.choices[0].message.content)

print()

# 실시간 스트리밍 답변 받기 (Streaming Request)
print("=== 스트리밍 답변 요청 ===")
stream = client.chat.completions.create(
    model="LGAI-EXAONE/EXAONE-Deep-2.4B-AWQ",
    messages=[
        {"role": "system", "content": "당신은 친절한 AI 요리사 도우미 입니다."},
        {"role": "user", "content": "맛있는 김치찌개를 끓이는 비법을 짧게 알려줘."}
    ],
    temperature=0.2,
    top_p=0.95,
    max_tokens=1024,
    stream=True, # 스트리밍 활성화
)

for chunk in stream:
    if chunk.choices[0].delta.content is not None:
        print(chunk.choices[0].delta.content, end="", flush=True)

print()
※ 참고
LG AI Research의 공식 가이드에 따르면 EXAONE Deep 모델은 시스템 프롬프트를 지원하지 않거나 권장하지 않는다. 시스템 프롬프트를 넣으면 모델이 지시사항을 무시하거나 추론(<thought>)을 시작하지 못하고 엉뚱한 답변을 낼 확률이 높아진다. 요리사 같은 페르소나는 아래와 같이 user 메시지 안에 녹여내자.
response = client.chat.completions.create(
    model="LGAI-EXAONE/EXAONE-Deep-2.4B-AWQ",
    messages=[
        # 시스템 프롬프트를 없애고 유저 메시지에 역할을 녹여낸다.
        {"role": "user", "content": "당신은 친절한 AI 도우미입니다. 인공지능과 거대언어모델(LLM)의 차이점을 한 문장으로 설명해줘."}
    ],
    temperature=0.2,
    top_p=0.95,
    max_tokens=1024
)
'AI, ML, DL' 카테고리의 다른 글
| [vLLM] WSL에서 vLLM 설치 및 간단한 실행 (1) | 2026.06.19 |
|---|---|
| [YOLO] YOLO-World (0) | 2026.06.16 |
| [Ollama] Ollama Backend Serve 백엔드 실행 (0) | 2026.06.14 |
| [Ollama] llava 동영상 분석 (0) | 2026.06.14 |
| [Ollama] Hugging Face 모델 설치 (Bllossom) (0) | 2026.06.14 |