반응형

wxChartDir을 이용해 간단한 실시간 차트를 그려보자.

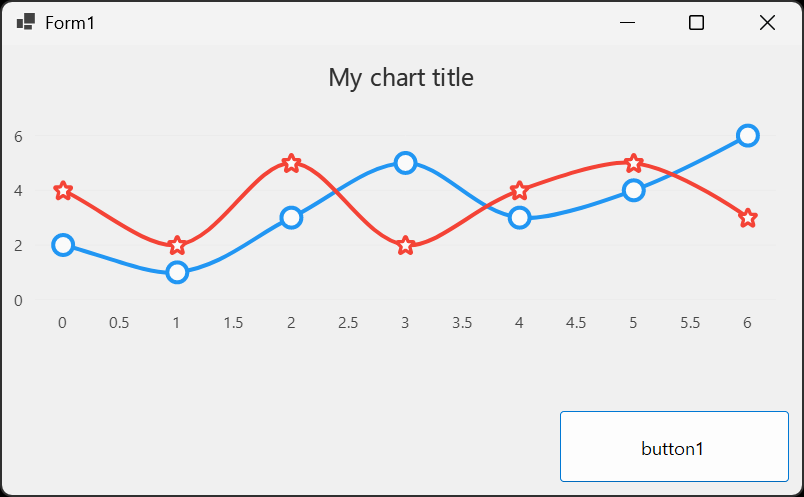
2026.05.05 - [C, C++] - [wxWidgets] wxChartDir 차트 그리기


#include <wx/wx.h>
#include <wxchartdir/chartdir.h>
#include <wxchartdir/wxchartviewer.h>
#include <time.h>
#include <stdlib.h>

#pragma comment(lib, "chartdir70.lib")
#pragma comment(lib, "wxchartdir.lib")

class MyApp : public wxApp
{
public:
	bool OnInit() override;
};

wxIMPLEMENT_APP(MyApp);

class MyFrame : public wxFrame
{
public:
	MyFrame();

private:
	void OnToggle(wxCommandEvent& event);
	void OnExit(wxCommandEvent& event);
	void OnAbout(wxCommandEvent& event);
	void OnTimer(wxTimerEvent& event);			// 실시간 업데이트를 위한 타이머 이벤트
	void drawChart(wxChartViewer* viewer);			// 차트를 갱신하는 함수

	wxPanel* m_panel;					// 차트를 담을 패널
	wxChartViewer* m_chartViewer;				// 차트를 담을 뷰어
	wxTimer m_timer;					// 주기적으로 차트를 갱신할 타이머

	static const int m_sampleSize = 100;			// 실시간으로 표시될 데이터 개수
	double m_timeStamps[m_sampleSize];			// X축 시간 데이터
	double m_dataSeries[m_sampleSize];			// Y축 값 데이터
};

enum
{
	ID_ToggleTimer = 1
};

bool MyApp::OnInit()
{
	MyFrame* frame = new MyFrame();
	frame->Show(true);
	return true;
}

// 메인 프레임의 위치(default position)와 크기(600x450)를 설정한다.
MyFrame::MyFrame() : wxFrame(nullptr, wxID_ANY, "Real-Time Chart Example", wxDefaultPosition, wxSize(600, 450))
{
	wxMenu* menuFile = new wxMenu;
	menuFile->Append(ID_ToggleTimer, "&Toggle Timer...\tCtrl-H", "Start/Stop the real-time update");
	menuFile->AppendSeparator();
	menuFile->Append(wxID_EXIT);

	wxMenu* menuHelp = new wxMenu;
	menuHelp->Append(wxID_ABOUT);

	wxMenuBar* menuBar = new wxMenuBar;
	menuBar->Append(menuFile, "&File");
	menuBar->Append(menuHelp, "&Help");

	SetMenuBar(menuBar);

	CreateStatusBar();
	SetStatusText("Welcome to Real-Time Chart!");

	m_panel = new wxPanel(this, wxID_ANY);

	wxButton* myButton = new wxButton(m_panel, wxID_ANY, "Toggle Timer", wxPoint(450, 10), wxSize(100, 30));
	myButton->Bind(wxEVT_BUTTON, &MyFrame::OnToggle, this); // 토글 버튼 이벤트와 타이머 토글 함수 연결

	Bind(wxEVT_MENU, &MyFrame::OnToggle, this, ID_ToggleTimer); // 토글 메뉴 아이템과 타이머 토글 함수 연결
	Bind(wxEVT_MENU, &MyFrame::OnAbout, this, wxID_ABOUT);
	Bind(wxEVT_MENU, &MyFrame::OnExit, this, wxID_EXIT);

	// 차트 뷰어 설정 및 위치/크기 고정
	m_chartViewer = new wxChartViewer(m_panel, wxID_ANY, wxPoint(10, 30), wxSize(550, 330));

	// 시간 배열과 데이터 배열 초기화
	// 현재 시간부터 과거로 100개의 타임스탬프를 생성 (250ms 간격), 데이터는 아직 없으므로 NoValue로 초기화
	double currentTime = Chart::chartTime2((int)time(0));
	// chartTime2는 int값을 차트에서 사용하는 시간 형식으로 변환하는 함수
	// time(0)은 현재 시간을 time_t 형식으로 반환하는 함수이며, 이를 int로 캐스팅하여 chartTime2에 전달한다.
	for (int i = 0; i < m_sampleSize; ++i) {
		m_timeStamps[i] = currentTime + (i - m_sampleSize) * 0.25; // 과거로 100개의 타임스탬프 생성 (250ms 간격)
		m_dataSeries[i] = Chart::NoValue; // 아직 데이터가 없으므로 NoValue 부여
	}

	// 타이머 시작 (250ms 마다 OnTimer 실행)
	m_timer.Bind(wxEVT_TIMER, &MyFrame::OnTimer, this, m_timer.GetId());
	m_timer.Start(250);

	// 초기 차트 그리기
	drawChart(m_chartViewer);
}

void MyFrame::OnExit(wxCommandEvent& event)
{
	Close(true);
}

void MyFrame::OnAbout(wxCommandEvent& event)
{
	wxMessageBox("This is a wxWidgets Hello World example", "About Hello World", wxOK | wxICON_INFORMATION);
}

void MyFrame::OnToggle(wxCommandEvent& event)
{
	// 타이머 일시정지/재시작 토글 처리
	if (m_timer.IsRunning()) {
		m_timer.Stop();
		SetStatusText("Timer Stopped.");
	}
	else {
		m_timer.Start(250);
		SetStatusText("Timer Started.");
	}
}

void MyFrame::OnTimer(wxTimerEvent& event)
{
	// 데이터를 하나씩 앞으로 이동 (Shift)
	for (int i = 1; i < m_sampleSize; ++i) {
		m_timeStamps[i - 1] = m_timeStamps[i];
		m_dataSeries[i - 1] = m_dataSeries[i];
	}

	// 가장 최신(마지막) 인덱스에 새 타임스탬프 입력
	m_timeStamps[m_sampleSize - 1] = m_timeStamps[m_sampleSize - 2] + 0.25; // 250ms 증가

	// 바로 직전 데이터에 랜덤 변화량을 주어 값을 생성 (Random Walk)
	double currentVal = (m_dataSeries[m_sampleSize - 2] == Chart::NoValue) ? 50 : m_dataSeries[m_sampleSize - 2];
	currentVal += (rand() % 11) - 5;

	// 값이 범위(10~90)를 크게 벗어나지 않게 보정
	if (currentVal < 10)
		currentVal = 10;
	if (currentVal > 90)
		currentVal = 90;

	m_dataSeries[m_sampleSize - 1] = currentVal;

	// 차트 갱신
	drawChart(m_chartViewer);
}

void MyFrame::drawChart(wxChartViewer* viewer)
{
	// 550x330 크기의 XYChart 객체 생성
	XYChart* c = new XYChart(550, 330);

	// 백그라운드 색상 및 플롯 영역, 그리드 크기 설정
	c->setBackground(0xeeeeee);
	// 플롯 영역을 설정 (x, y, width, height) 및 배경색, 대체색(-1), 엣지색(-1), 가로 그리드색, 세로 그리드색
	c->setPlotArea(40, 20, 480, 260, 0xffffff, -1, -1, 0xcccccc, 0xcccccccc);

	// X축을 시간 포맷(hh:nn:ss)으로 설정
	c->xAxis()->setLabelFormat("{value|hh:nn:ss}"); // value: 차트가 표시하는 값, hh:nn:ss: 시간 포맷	
	c->xAxis()->setTickDensity(75); // X축 눈금 간격을 조절하여 시간 간격이 일정하게 보이도록 설정 (75 픽셀마다 눈금 표시)
	c->xAxis()->setTitle("Time");

	// Y축은 실시간 데이터 변동이 보이게 크기를 고정 (0~100)
	c->yAxis()->setLinearScale(0, 100, 20); // 0부터 100까지 20 간격으로 눈금 표시
	c->yAxis()->setTitle("Value");

	// 라인 레이어를 생성하고 선 색상을 지정, "Live Data"는 범례(Legend)에 표시될 이름
	LineLayer* layer = c->addLineLayer(DoubleArray(m_dataSeries, m_sampleSize), 0xff0000, "Live Data");
	layer->setXData(DoubleArray(m_timeStamps, m_sampleSize));
	layer->setLineWidth(2); // 선의 두께를 2로 설정하여 실시간 데이터의 변동이 더 잘 보이도록 함
	// 범례(Lengend) 박스 설정 (x, y, vertical layout, font, font size) 및 배경색과 테두리 색상
	c->addLegend(430, 30, false, "Arial Bold", 9)->setBackground(0xeeeeee, 0xcccccc);

	// 생성한 차트를 뷰어에 연결하면 내부적으로 화면이 갱신됨
	viewer->setChart(c);
	//viewer->updateViewPort(true, true); // 뷰포트 업데이트 (차트가 변경되었음을 알림)
	// setchart()는 새로운 차트를 뷰어에 설정하는 함수이고, updateViewPort()는 뷰포트가 변경되었음을 알리는 함수이다.
	// setchart()를 호출하면 내부적으로 차트가 변경되었다고 인식하지만, updateViewPort()를 명시적으로 호출하여 뷰포트
	// 업데이트를 트리거하는 것이 좋다. 이렇게 하면 차트가 변경된 후에 뷰포트가 올바르게 갱신되어 화면에 최신 차트가 표시된다.
	// 지금은 마우스 휠로 확대/축소하는 기능은 없지만 그런 기능이 추가되면 차트가 변경될 때마다 명시적으로 updateViewPort()를
	// 호출하여 뷰포트를 갱신하는 것이 좋다.

	// ChartViewer에 넣은 뒤 완벽하게 안전하게 지울 수 있음
	delete c;
}


단순한 배열이 아닌 deque 자료구조를 사용해 보자.

#include <wx/wx.h>
#include <wxchartdir/chartdir.h>
#include <wxchartdir/wxchartviewer.h>
#include <time.h>
#include <stdlib.h>
#include <deque>

#pragma comment(lib, "chartdir70.lib")
#pragma comment(lib, "wxchartdir.lib")

class MyApp : public wxApp
{
public:
	bool OnInit() override;
};

wxIMPLEMENT_APP(MyApp);

class MyFrame : public wxFrame
{
public:
	MyFrame();

private:
	void OnToggle(wxCommandEvent& event);
	void OnExit(wxCommandEvent& event);
	void OnAbout(wxCommandEvent& event);
	void OnTimer(wxTimerEvent& event);			// 실시간 업데이트를 위한 타이머 이벤트
	void drawChart(wxChartViewer* viewer);			// 차트를 갱신하는 함수

	wxPanel* m_panel;					// 차트를 담을 패널
	wxChartViewer* m_chartViewer;				// 차트를 담을 뷰어
	wxTimer m_timer;					// 주기적으로 차트를 갱신할 타이머

	static const int m_sampleSize = 100;			// 실시간으로 표시될 데이터 개수
	std::deque<double> m_timeStamps;			// X축 시간 데이터
	std::deque<double> m_dataSeries;			// Y축 값 데이터
};

enum
{
	ID_ToggleTimer = 1
};

bool MyApp::OnInit()
{
	MyFrame* frame = new MyFrame();
	frame->Show(true);
	return true;
}

// 메인 프레임의 위치(default position)와 크기(600x450)를 설정한다.
MyFrame::MyFrame() : wxFrame(nullptr, wxID_ANY, "Real-Time Chart Example", wxDefaultPosition, wxSize(600, 450))
{
	wxMenu* menuFile = new wxMenu;
	menuFile->Append(ID_ToggleTimer, "&Toggle Timer...\tCtrl-H", "Start/Stop the real-time update");
	menuFile->AppendSeparator();
	menuFile->Append(wxID_EXIT);

	wxMenu* menuHelp = new wxMenu;
	menuHelp->Append(wxID_ABOUT);

	wxMenuBar* menuBar = new wxMenuBar;
	menuBar->Append(menuFile, "&File");
	menuBar->Append(menuHelp, "&Help");

	SetMenuBar(menuBar);

	CreateStatusBar();
	SetStatusText("Welcome to Real-Time Chart!");

	m_panel = new wxPanel(this, wxID_ANY);

	wxButton* myButton = new wxButton(m_panel, wxID_ANY, "Toggle Timer", wxPoint(450, 10), wxSize(100, 30));
	myButton->Bind(wxEVT_BUTTON, &MyFrame::OnToggle, this); // 토글 버튼 이벤트와 타이머 토글 함수 연결

	Bind(wxEVT_MENU, &MyFrame::OnToggle, this, ID_ToggleTimer); // 토글 메뉴 아이템과 타이머 토글 함수 연결
	Bind(wxEVT_MENU, &MyFrame::OnAbout, this, wxID_ABOUT);
	Bind(wxEVT_MENU, &MyFrame::OnExit, this, wxID_EXIT);

	// 차트 뷰어 설정 및 위치/크기 고정
	m_chartViewer = new wxChartViewer(m_panel, wxID_ANY, wxPoint(10, 30), wxSize(550, 330));

	// 시간 배열과 데이터 배열 초기화
	// 현재 시간부터 과거로 100개의 타임스탬프를 생성 (250ms 간격), 데이터는 아직 없으므로 NoValue로 초기화
	double currentTime = Chart::chartTime2((int)time(0));
	// chartTime2는 int값을 차트에서 사용하는 시간 형식으로 변환하는 함수
	// time(0)은 현재 시간을 time_t 형식으로 반환하는 함수이며, 이를 int로 캐스팅하여 chartTime2에 전달한다.
	for (int i = 0; i < m_sampleSize; ++i) {
		m_timeStamps.push_back(currentTime + (i - m_sampleSize) * 0.25); // 과거로 100개의 타임스탬프 생성 (250ms 간격)
		m_dataSeries.push_back(Chart::NoValue); // 아직 데이터가 없으므로 NoValue 부여
	}

	// 타이머 시작 (250ms 마다 OnTimer 실행)
	m_timer.Bind(wxEVT_TIMER, &MyFrame::OnTimer, this, m_timer.GetId());
	m_timer.Start(250);

	// 초기 차트 그리기
	drawChart(m_chartViewer);
}

void MyFrame::OnExit(wxCommandEvent& event)
{
	Close(true);
}

void MyFrame::OnAbout(wxCommandEvent& event)
{
	wxMessageBox("This is a wxWidgets Hello World example", "About Hello World", wxOK | wxICON_INFORMATION);
}

void MyFrame::OnToggle(wxCommandEvent& event)
{
	// 타이머 일시정지/재시작 토글 처리
	if (m_timer.IsRunning()) {
		m_timer.Stop();
		SetStatusText("Timer Stopped.");
	}
	else {
		m_timer.Start(250);
		SetStatusText("Timer Started.");
	}
}

void MyFrame::OnTimer(wxTimerEvent& event)
{
	// 데이터 업데이트: 가장 오래된 타임스탬프와 데이터 제거, 새로운 타임스탬프와 데이터 추가
	m_timeStamps.pop_front(); // 가장 오래된 타임스탬프 제거
	m_dataSeries.pop_front(); // 가장 오래된 데이터 제거

	// 새로운 타임스탬프 추가: 가장 최신 타임스탬프에 250ms를 더하여 새로운 타임스탬프 생성
	//m_timeStamps[m_sampleSize - 1] = m_timeStamps[m_sampleSize - 2] + 0.25; // 250ms 증가
	m_timeStamps.push_back(m_timeStamps.back() + 0.25); // 가장 최신 타임스탬프에 250ms 증가하여 추가


	// 바로 직전 데이터에 랜덤 변화량을 주어 값을 생성 (Random Walk)
	double currentVal = (m_dataSeries.empty() || m_dataSeries.back() == Chart::NoValue) ? 50 : m_dataSeries.back();
	currentVal += (rand() % 11) - 5;

	// 값이 범위(10~90)를 크게 벗어나지 않게 보정
	if (currentVal < 10)
		currentVal = 10;
	if (currentVal > 90)
		currentVal = 90;

	m_dataSeries.push_back(currentVal); // 가장 최신 데이터 추가

	// 차트 갱신
	drawChart(m_chartViewer);
}

void MyFrame::drawChart(wxChartViewer* viewer)
{
	// 550x330 크기의 XYChart 객체 생성
	XYChart* c = new XYChart(550, 330);

	// 백그라운드 색상 및 플롯 영역, 그리드 크기 설정
	c->setBackground(0xeeeeee);
	// 플롯 영역을 설정 (x, y, width, height) 및 배경색, 대체색(-1), 엣지색(-1), 가로 그리드색, 세로 그리드색
	c->setPlotArea(40, 20, 480, 260, 0xffffff, -1, -1, 0xcccccc, 0xcccccccc);

	// X축을 시간 포맷(hh:nn:ss)으로 설정
	c->xAxis()->setLabelFormat("{value|hh:nn:ss}"); // value: 차트가 표시하는 값, hh:nn:ss: 시간 포맷	
	c->xAxis()->setTickDensity(75); // X축 눈금 간격을 조절하여 시간 간격이 일정하게 보이도록 설정 (75 픽셀마다 눈금 표시)
	c->xAxis()->setTitle("Time");

	// Y축은 실시간 데이터 변동이 보이게 크기를 고정 (0~100)
	c->yAxis()->setLinearScale(0, 100, 20); // 0부터 100까지 20 간격으로 눈금 표시
	c->yAxis()->setTitle("Value");

	// 라인 레이어를 생성하고 선 색상을 지정, "Live Data"는 범례(Legend)에 표시될 이름
	// m_dataSeries와 m_timeStamps는 deque이므로, 이를 벡터로 변환하고 데이터만 DoubleArray로 전달하여 차트에 데이터를 설정한다.
	// 이렇게 변환해야 하기때문에 애초에 벡터로 선언하는게 나았을 수도 있지만 deque로 선언한 이유는 실시간 데이터 업데이트에서
	// 앞의 데이터를 제거하고 뒤에 새로운 데이터를 추가만하는 작업이 더 효율적이기 때문이다. 벡터는 앞의 데이터를 제거할 때 모든
	// 요소를 이동해야 하지만, deque는 양쪽에서 삽입과 삭제가 가능하므로 작업이 더 효율적이다. 그냥 내 추측이다.
	LineLayer* layer = c->addLineLayer(DoubleArray(std::vector<double>(m_dataSeries.begin(), m_dataSeries.end()).data(), m_dataSeries.size()), 0xff0000, "Live Data");
	layer->setXData(DoubleArray(std::vector<double>(m_timeStamps.begin(), m_timeStamps.end()).data(), m_timeStamps.size()));
	layer->setLineWidth(2); // 선의 두께를 2로 설정하여 실시간 데이터의 변동이 더 잘 보이도록 함
	// 범례(Lengend) 박스 설정 (x, y, vertical layout, font, font size) 및 배경색과 테두리 색상
	c->addLegend(430, 30, false, "Arial Bold", 9)->setBackground(0xeeeeee, 0xcccccc);

	// 생성한 차트를 뷰어에 연결하면 내부적으로 화면이 갱신됨
	viewer->setChart(c);
	//viewer->updateViewPort(true, true); // 뷰포트 업데이트 (차트가 변경되었음을 알림)
	// setchart()는 새로운 차트를 뷰어에 설정하는 함수이고, updateViewPort()는 뷰포트가 변경되었음을 알리는 함수이다.
	// setchart()를 호출하면 내부적으로 차트가 변경되었다고 인식하지만, updateViewPort()를 명시적으로 호출하여 뷰포트
	// 업데이트를 트리거하는 것이 좋다. 이렇게 하면 차트가 변경된 후에 뷰포트가 올바르게 갱신되어 화면에 최신 차트가 표시된다.
	// 지금은 마우스 휠로 확대/축소하는 기능은 없지만 그런 기능이 추가되면 차트가 변경될 때마다 명시적으로 updateViewPort()를
	// 호출하여 뷰포트를 갱신하는 것이 좋다.

	// ChartViewer에 넣은 뒤 완벽하게 안전하게 지울 수 있음
	delete c;
}


결과는 위 코드와 동일하다.


※ 참고

Documnetation


반응형
Posted by J-sean
:
반응형

wxChartDir은 ChartDir(ChartDirector)의 wxWidgets 프레임워크 래퍼(wrapper)다.

실제 차트를 그리고(렌더링) 데이터를 처리하는 핵심 엔진은 ChartDir이기 때문에, wxChartDir을 사용하려면 ChartDir이 필요하다.

wxChartDir로 wxWidgets 애플리케이션에 차트를 그려보자.


우선 wxChartDir을 빌드하자.

vcpkg install wxchartdir


ChartDirector에서 ChartDirector for C++을 다운로드받자.


다운로드받은 ChartDirector for C++을 확인해 보면 위와 같은 구조로 되어 있는데, 개발에 필요한 부분은 include와 lib64(또는 lib32) 디렉토리의 파일들이다.

위에서 vcpkg로 빌드한 wxChartDir의 폴더에 각각의 파일을 복사해 넣자. (chartdirXX.dll 파일도 lib64 디렉토리에 있다)


Include, Library 폴더 등을 적당히 세팅하고 아래 코드를 입력한다.

#include <wx/wx.h>
#include <wxchartdir/chartdir.h>
#include <wxchartdir/wxchartviewer.h>

#pragma comment(lib, "chartdir70.lib")
#pragma comment(lib, "wxchartdir.lib")

class MyApp : public wxApp
{
public:
	bool OnInit() override;
};

wxIMPLEMENT_APP(MyApp);

class MyFrame : public wxFrame
{
public:
	MyFrame();

private:
	void OnHello(wxCommandEvent& event);
	void OnExit(wxCommandEvent& event);
	void OnAbout(wxCommandEvent& event);

	wxPanel* panel;
};

enum
{
	ID_Hello = 1
};

bool MyApp::OnInit()
{
	MyFrame* frame = new MyFrame();
	frame->Show(true);
	return true;
}

// 메인 프레임의 위치(default position)와 크기(550x400)를 설정한다.
MyFrame::MyFrame() : wxFrame(nullptr, wxID_ANY, "Hello World", wxDefaultPosition, wxSize(550, 400))
{
	wxMenu* menuFile = new wxMenu;
	menuFile->Append(ID_Hello, "&Hello...\tCtrl-H", "Help string shown in status bar for this menu item");
	menuFile->AppendSeparator();
	menuFile->Append(wxID_EXIT);

	wxMenu* menuHelp = new wxMenu;
	menuHelp->Append(wxID_ABOUT);

	wxMenuBar* menuBar = new wxMenuBar;
	menuBar->Append(menuFile, "&File");
	menuBar->Append(menuHelp, "&Help");

	SetMenuBar(menuBar);

	CreateStatusBar();
	SetStatusText("Welcome to wxWidgets!");

	panel = new wxPanel(this, wxID_ANY);

	wxButton* myButton = new wxButton(panel, wxID_ANY, "Press Me", wxPoint(420, 30), wxSize(100, 30));
	myButton->Bind(wxEVT_BUTTON, &MyFrame::OnHello, this);

	Bind(wxEVT_MENU, &MyFrame::OnHello, this, ID_Hello);
	Bind(wxEVT_MENU, &MyFrame::OnAbout, this, wxID_ABOUT);
	Bind(wxEVT_MENU, &MyFrame::OnExit, this, wxID_EXIT);
}

void MyFrame::OnExit(wxCommandEvent& event)
{
	Close(true);
}

void MyFrame::OnAbout(wxCommandEvent& event)
{
	wxMessageBox("This is a wxWidgets Hello World example", "About Hello World", wxOK | wxICON_INFORMATION);
}

void MyFrame::OnHello(wxCommandEvent& event)
{
	// 데이터와 라벨 준비
	double data[] = { 85, 156, 179.5, 211, 123 };
	const char* labels[] = { "Mon", "Tue", "Wed", "Thu", "Fri" };

	// 400x300 크기의 XYChart 객체 생성
	XYChart* c = new XYChart(400, 300);

	// 플롯 영역 설정 (여백 조정)
	c->setPlotArea(40, 20, 300, 250);

	// 바 차트 레이어 추가
	c->addBarLayer(DoubleArray(data, (int)(sizeof(data) / sizeof(data[0]))));

	// X축에 라벨 설정
	c->xAxis()->setLabels(StringArray(labels, (int)(sizeof(labels) / sizeof(labels[0]))));

	// 차트 뷰어 생성 (wxPanel 위에 위치)
	wxChartViewer* chartViewer = new wxChartViewer(panel, wxID_ANY, wxPoint(10, 10), wxSize(400, 300));

	// 생성한 차트를 뷰어에 연결
	// wxChartViewer는 setChart에서 내부적으로 상태를 업데이트하거나 사용할 수 있지만, 
	// 라이브러리의 방식에 따라 BaseChart(XYChart)의 생명주기를 어떻게 관리해야 할지 주의해야 한다.
	chartViewer->setChart(c);

	// 문서에 따르면 setChart를 호출한 후 곧바로 BaseChart를 삭제하거나 로컬 스택에 할당하는 것도 완벽하게 안전하다.
	// "So it is perfectly safe to immediately delete the BaseChart after calling wxChartViewer::setChart"
	delete c;
}


버튼을 클릭하면 차트가 표시된다.


ChartDirector는 상용 라이브러리이기 때문에 라이선스를 구입하지 않으면 아래에 노란 광고가 표시된다.


더보기

ChartViewer의 크기를 XYChart 객체보다 10픽셀 정도(정확히는 9픽셀) 작게 하면 노란 광고를 보이지 않게 할 수 있다.  

(이 예제는 필요 없지만, X축 레이블이 광고와 겹친다면 setPlotArea()에서 플롯 영역의 높이도 조정해야 한다, 아래 히스토그램 예제 참고)

.
.
.
// 400x300 크기의 XYChart 객체 생성
XYChart* c = new XYChart(400, 300);
.
.
.
// 차트 뷰어 생성 (wxPanel 위에 위치)
wxChartViewer* chartViewer = new wxChartViewer(panel, wxID_ANY, wxPoint(10, 10), wxSize(400, 300-10));
// 차트 뷰어의 크기를 XYChart 객체보다 10픽셀 정도 작게 설정하면 노란 광고 배너가 보이지 않게 된다.
.
.
.


Line Chart를 만들어 보자.

#include <wx/wx.h>
#include <wxchartdir/chartdir.h>
#include <wxchartdir/wxchartviewer.h>

#pragma comment(lib, "chartdir70.lib")
#pragma comment(lib, "wxchartdir.lib")

class MyApp : public wxApp
{
public:
	bool OnInit() override;
};

wxIMPLEMENT_APP(MyApp);

class MyFrame : public wxFrame
{
public:
	MyFrame();

private:
	void OnHello(wxCommandEvent& event);
	void OnExit(wxCommandEvent& event);
	void OnAbout(wxCommandEvent& event);

	wxPanel* panel;
};

enum
{
	ID_Hello = 1
};

bool MyApp::OnInit()
{
	MyFrame* frame = new MyFrame();
	frame->Show(true);
	return true;
}

// 메인 프레임의 위치(default position)와 크기(550x400)를 설정한다.
MyFrame::MyFrame() : wxFrame(nullptr, wxID_ANY, "Hello World", wxDefaultPosition, wxSize(550, 400))
{
	wxMenu* menuFile = new wxMenu;
	menuFile->Append(ID_Hello, "&Hello...\tCtrl-H", "Help string shown in status bar for this menu item");
	menuFile->AppendSeparator();
	menuFile->Append(wxID_EXIT);

	wxMenu* menuHelp = new wxMenu;
	menuHelp->Append(wxID_ABOUT);

	wxMenuBar* menuBar = new wxMenuBar;
	menuBar->Append(menuFile, "&File");
	menuBar->Append(menuHelp, "&Help");

	SetMenuBar(menuBar);

	CreateStatusBar();
	SetStatusText("Welcome to wxWidgets!");

	panel = new wxPanel(this, wxID_ANY);

	wxButton* myButton = new wxButton(panel, wxID_ANY, "Press Me", wxPoint(420, 30), wxSize(100, 30));
	myButton->Bind(wxEVT_BUTTON, &MyFrame::OnHello, this);

	Bind(wxEVT_MENU, &MyFrame::OnHello, this, ID_Hello);
	Bind(wxEVT_MENU, &MyFrame::OnAbout, this, wxID_ABOUT);
	Bind(wxEVT_MENU, &MyFrame::OnExit, this, wxID_EXIT);
}

void MyFrame::OnExit(wxCommandEvent& event)
{
	Close(true);
}

void MyFrame::OnAbout(wxCommandEvent& event)
{
	wxMessageBox("This is a wxWidgets Hello World example", "About Hello World", wxOK | wxICON_INFORMATION);
}

void MyFrame::OnHello(wxCommandEvent& event)
{
	// The data for the line chart
	double data[] = { 30, 28, 40, 55, 75, 68, 54, 60, 50, 62, 75, 65, 75, 91, 60, 55, 53, 35, 50, 66,
		56, 48, 52, 65, 62 };
	const int data_size = (int)(sizeof(data) / sizeof(*data));

	// The labels for the line chart
	const char* labels[] = { "0", "1", "2", "3", "4", "5", "6", "7", "8", "9", "10", "11", "12",
		"13", "14", "15", "16", "17", "18", "19", "20", "21", "22", "23", "24" };
	const int labels_size = (int)(sizeof(labels) / sizeof(*labels));

	// Create a XYChart object of size 250 x 250 pixels
	XYChart* c = new XYChart(250, 250);

	// Set the plotarea at (30, 20) and of size 200 x 200 pixels
	c->setPlotArea(30, 20, 200, 200);

	// Add a line chart layer using the given data
	c->addLineLayer(DoubleArray(data, data_size));

	// Set the labels on the x axis.
	c->xAxis()->setLabels(StringArray(labels, labels_size));

	// Display 1 out of 3 labels on the x-axis.
	c->xAxis()->setLabelStep(3);

	// Create a ChartViewer to display the chart 
	wxChartViewer* chartViewer = new wxChartViewer(panel, wxID_ANY, wxPoint(10, 10), wxSize(250, 250));
	chartViewer->setChart(c);

	//free up resources
	delete c;
}


간단한 리얼타임 차트 만들기

2026.05.10 - [C, C++] - [wxWidgets] wxChartDir Simple Real-Time Chart 간단한 리얼타임 차트


히스토그램과 벨 커브를 그려보자.

#include <wx/wx.h>
#include <wxchartdir/chartdir.h>
#include <wxchartdir/wxchartviewer.h>

#include <math.h>

#pragma comment(lib, "chartdir70.lib")
#pragma comment(lib, "wxchartdir.lib")

class MyApp : public wxApp
{
public:
	bool OnInit() override;
};

wxIMPLEMENT_APP(MyApp);

class MyFrame : public wxFrame
{
public:
	MyFrame();

private:
	void OnHello(wxCommandEvent& event);
	void OnExit(wxCommandEvent& event);
	void OnAbout(wxCommandEvent& event);

	wxPanel* panel;
};

enum
{
	ID_Hello = 1
};

bool MyApp::OnInit()
{
	MyFrame* frame = new MyFrame();
	frame->Show(true);
	return true;
}

// 메인 프레임의 위치(default position)와 크기(750x500)를 설정한다.
MyFrame::MyFrame() : wxFrame(nullptr, wxID_ANY, "Hello World", wxDefaultPosition, wxSize(750, 500))
{
	wxMenu* menuFile = new wxMenu;
	menuFile->Append(ID_Hello, "&Hello...\tCtrl-H", "Help string shown in status bar for this menu item");
	menuFile->AppendSeparator();
	menuFile->Append(wxID_EXIT);

	wxMenu* menuHelp = new wxMenu;
	menuHelp->Append(wxID_ABOUT);

	wxMenuBar* menuBar = new wxMenuBar;
	menuBar->Append(menuFile, "&File");
	menuBar->Append(menuHelp, "&Help");

	SetMenuBar(menuBar);

	CreateStatusBar();
	SetStatusText("Welcome to wxWidgets!");

	panel = new wxPanel(this, wxID_ANY);

	wxButton* myButton = new wxButton(panel, wxID_ANY, "Press Me", wxPoint(620, 30), wxSize(100, 30));
	myButton->Bind(wxEVT_BUTTON, &MyFrame::OnHello, this);

	Bind(wxEVT_MENU, &MyFrame::OnHello, this, ID_Hello);
	Bind(wxEVT_MENU, &MyFrame::OnAbout, this, wxID_ABOUT);
	Bind(wxEVT_MENU, &MyFrame::OnExit, this, wxID_EXIT);
}

void MyFrame::OnExit(wxCommandEvent& event)
{
	Close(true);
}

void MyFrame::OnAbout(wxCommandEvent& event)
{
	wxMessageBox("This is a wxWidgets Hello World example", "About Hello World", wxOK | wxICON_INFORMATION);
}

void MyFrame::OnHello(wxCommandEvent& event)
{
	char buffer[1024];

	//
	// This example demonstrates creating a histogram with a bell curve from raw data. About half of
	// the code is to sort the raw data into slots and to generate the points on the bell curve. The
	// remaining half of the code is the actual charting code.
	//

	// 히스토그램 및 벨 커브 데이터 생성

	// Generate a random guassian distributed data series as the input data for this example.
	RanSeries* r = new RanSeries(66);
	DoubleArray samples = r->getGaussianSeries(200, 100, 10);

	//
	// Classify the numbers into slots. In this example, the slot width is 5 units.
	//
	double slotSize = 5;

	// Compute the min and max values, and extend them to the slot boundary.
	ArrayMath m = ArrayMath(samples);
	double minX = (int)(m.minValue() / slotSize) * slotSize;
	double maxX = (int)(m.maxValue() / slotSize) * slotSize + slotSize;

	// We can now determine the number of slots
	// slot의 개수를 계산한다. slotCount는 (maxX - minX) / slotSize로 계산되며, 소수점 첫째 자리에서 반올림하여 정수로 변환된다.
	int slotCount = (int)((maxX - minX) / slotSize + 0.5);
	double* frequency = new double[slotCount];
	memset(frequency, 0, sizeof(*frequency) * slotCount);

	// Count the data points contained in each slot
	// frequency에 각 slot에 해당하는 데이터 포인트의 개수를 저장한다. samples 배열의 각 요소에 대해, 해당 요소가 속하는 slot의
	// 인덱스를 계산하여 frequency 배열에서 해당 slot의 개수를 증가시킨다. slotIndex는 (samples[i] - minX) / slotSize로 계산되며
	// 이는 samples[i]가 minX에서 시작하여 slotSize 간격으로 나누어진 slot 중 어디에 위치하는지를 나타낸다.
	for (int i = 0; i < samples.len; ++i) {
		int slotIndex = (int)((samples[i] - minX) / slotSize);
		frequency[slotIndex] = frequency[slotIndex] + 1;
	}

	//
	// Compute Normal Distribution Curve
	//

	// The mean and standard deviation of the data
	double mean = m.avg();
	double stdDev = m.stdDev();

	// The normal distribution curve (bell curve) is a standard statistics curve. We need to
	// vertically scale it to make it proportion to the frequency count.
	double scaleFactor = slotSize * samples.len / stdDev / sqrt(2 * 3.1416);

	// In this example, we plot the bell curve up to 3 standard deviations.
	double stdDevWidth = 3.0;

	// We generate 4 points per standard deviation to be joined with a spline curve.
	int bellCurveResolution = (int)(stdDevWidth * 4 + 1);
	double* bellCurve = new double[bellCurveResolution];
	for (int i = 0; i < bellCurveResolution; ++i) {
		double z = 2 * i * stdDevWidth / (bellCurveResolution - 1) - stdDevWidth;
		bellCurve[i] = exp(-z * z / 2) * scaleFactor;
	}

	//
	// At this stage, we have obtained all data and can plot the chart.
	//

	// 히스토그램과 벨 커브 차트 생성

	// Create a XYChart object of size 600 x 360 pixels
	XYChart* c = new XYChart(600, 360);

	// Set the plotarea at (50, 30) and of size 500 x 300 pixels, with transparent background and
	// border and light grey (0xcccccc) horizontal grid lines
	c->setPlotArea(50, 30, 500, 300, Chart::Transparent, -1, Chart::Transparent, 0xcccccc);
	// 이 예제대로 플롯 영역의 높이를 300으로 설정하면 노란 광고 배너가 플롯 영역의 x축 레이블과 겹쳐서 보이게 된다.
	// 플롯 영역의 높이를 20정도 줄이면(300-20) 광고 배너와 겹치지 않게 된다. 그리고 아래 chartViewer의 크기도 20정도
	// 줄이면(360-20) 광고 배너도 보이지않게 할 수 있다.

	// Display the mean and standard deviation on the chart
	sprintf(buffer, "Mean = %.1f, Standard Deviation = %.1f", mean, stdDev);
	c->addTitle(buffer, "Arial");

	// Set the x and y axis label font to 12pt Arial
	c->xAxis()->setLabelStyle("Arial", 12);
	c->yAxis()->setLabelStyle("Arial", 12);

	// Set the x and y axis stems to transparent, and the x-axis tick color to grey (0x888888)
	c->xAxis()->setColors(Chart::Transparent, Chart::TextColor, Chart::TextColor, 0x888888);
	c->yAxis()->setColors(Chart::Transparent);

	// 벨 커브 그리기, 벨 커브가 필요 없다면 이 부분을 제거하면 된다.
	// Draw the bell curve as a spline layer in red (0xdd0000) with 2-pixel line width
	SplineLayer* bellLayer = c->addSplineLayer(DoubleArray(bellCurve, bellCurveResolution), 0xdd0000
	);
	bellLayer->setXData(mean - stdDevWidth * stdDev, mean + stdDevWidth * stdDev);
	bellLayer->setLineWidth(2);

	// 히스토그램 그리기
	// Draw the histogram as bars in blue (0x6699bb) with dark blue (0x336688) border
	BarLayer* histogramLayer = c->addBarLayer(DoubleArray(frequency, slotCount), 0x6699bb);
	histogramLayer->setBorderColor(0x336688);
	// The center of the bars span from minX + half_bar_width to maxX - half_bar_width
	histogramLayer->setXData(minX + slotSize / 2.0, maxX - slotSize / 2.0);
	// Configure the bars to touch each other with no gap in between
	histogramLayer->setBarGap(Chart::TouchBar);
	// Use rounded corners for decoration
	histogramLayer->setRoundedCorners();

	// ChartDirector by default will extend the x-axis scale by 0.5 unit to cater for the bar width.
	// It is because a bar plotted at x actually occupies (x +/- half_bar_width), and the bar width
	// is normally 1 for label based x-axis. However, this chart is using a linear x-axis instead of
	// label based. So we disable the automatic extension and add a dummy layer to extend the x-axis
	// scale to cover minX to maxX.
	c->xAxis()->setIndent(false);
	c->addLineLayer()->setXData(minX, maxX);

	// For the automatic y-axis labels, set the minimum spacing to 40 pixels.
	c->yAxis()->setTickDensity(40);

	// 차트 뷰어 생성 (wxPanel 위에 위치)
	wxChartViewer* chartViewer = new wxChartViewer(panel, wxID_ANY, wxPoint(10, 10), wxSize(600, 360));

	// 생성한 차트를 뷰어에 연결
	chartViewer->setChart(c);

	// 문서에 따르면 setChart를 호출한 후 곧바로 BaseChart를 삭제하거나 로컬 스택에 할당하는 것도 완벽하게 안전하다.
	// "So it is perfectly safe to immediately delete the BaseChart after calling wxChartViewer::setChart"
	delete c;
}


Angular Meter를 만들어 보자.

#include <wx/wx.h>
#include <wxchartdir/chartdir.h>
#include <wxchartdir/wxchartviewer.h>

#pragma comment(lib, "chartdir70.lib")
#pragma comment(lib, "wxchartdir.lib")

class MyApp : public wxApp
{
public:
	bool OnInit() override;
};

wxIMPLEMENT_APP(MyApp);

class MyFrame : public wxFrame
{
public:
	MyFrame();

private:
	void OnHello(wxCommandEvent& event);
	void OnExit(wxCommandEvent& event);
	void OnAbout(wxCommandEvent& event);

	wxPanel* panel;
};

enum
{
	ID_Hello = 1
};

bool MyApp::OnInit()
{
	MyFrame* frame = new MyFrame();
	frame->Show(true);
	return true;
}

// 메인 프레임의 위치(default position)와 크기(550x400)를 설정한다.
MyFrame::MyFrame() : wxFrame(nullptr, wxID_ANY, "Hello World", wxDefaultPosition, wxSize(550, 400))
{
	wxMenu* menuFile = new wxMenu;
	menuFile->Append(ID_Hello, "&Hello...\tCtrl-H", "Help string shown in status bar for this menu item");
	menuFile->AppendSeparator();
	menuFile->Append(wxID_EXIT);

	wxMenu* menuHelp = new wxMenu;
	menuHelp->Append(wxID_ABOUT);

	wxMenuBar* menuBar = new wxMenuBar;
	menuBar->Append(menuFile, "&File");
	menuBar->Append(menuHelp, "&Help");

	SetMenuBar(menuBar);

	CreateStatusBar();
	SetStatusText("Welcome to wxWidgets!");

	panel = new wxPanel(this, wxID_ANY);

	wxButton* myButton = new wxButton(panel, wxID_ANY, "Press Me", wxPoint(420, 30), wxSize(100, 30));
	myButton->Bind(wxEVT_BUTTON, &MyFrame::OnHello, this);

	Bind(wxEVT_MENU, &MyFrame::OnHello, this, ID_Hello);
	Bind(wxEVT_MENU, &MyFrame::OnAbout, this, wxID_ABOUT);
	Bind(wxEVT_MENU, &MyFrame::OnExit, this, wxID_EXIT);
}

void MyFrame::OnExit(wxCommandEvent& event)
{
	Close(true);
}

void MyFrame::OnAbout(wxCommandEvent& event)
{
	wxMessageBox("This is a wxWidgets Hello World example", "About Hello World", wxOK | wxICON_INFORMATION);
}

void MyFrame::OnHello(wxCommandEvent& event)
{
	// The value to display on the meter
	double value = 72.55;

	// Create an AngularMeter object of size 300 x 180 pixels with transparent background
	//AngularMeter* m = new AngularMeter(300, 180, Chart::Transparent);
	// 
	// Chart::Transparent는 wxChartViewer에서 검정색으로 렌더링될 수 있으므로, 패널의 배경색을 설정한다.
	wxColour bgColour = panel->GetBackgroundColour();
	int chartBgColor = (bgColour.Red() << 16) | (bgColour.Green() << 8) | bgColour.Blue();
	AngularMeter* m = new AngularMeter(300, 180, chartBgColor);

	// Center at (150, 150), scale radius = 128 pixels, scale angle -90 to +90 degrees
	m->setMeter(150, 150, 128, -90, 90);

	// Add a pale grey (0xeeeeee) scale background of 148 pixels radius, with a 10 pixel thick light
	// grey (0xcccccc) border
	m->addScaleBackground(148, 0xeeeeee, 10, 0xcccccc);

	// Meter scale is 0 - 100, with major tick every 20 units, minor tick every 10 units, and micro
	// tick every 5 units
	m->setScale(0, 100, 20, 10, 5);

	// Set the scale label style to 15pt Arial Italic. Set the major/minor/micro tick lengths to
	// 16/16/10 pixels pointing inwards, and their widths to 2/1/1 pixels.
	m->setLabelStyle("Arial Italic", 16);
	m->setTickLength(-16, -16, -10);
	m->setLineWidth(0, 2, 1, 1);

	// Add a smooth color scale to the meter
	double smoothColorScale[] = { 0, 0x3333ff, 25, 0x0088ff, 50, 0x00ff00, 75, 0xdddd00, 100, 0xff0000 };
	const int smoothColorScale_size = (int)(sizeof(smoothColorScale) / sizeof(*smoothColorScale));
	m->addColorScale(DoubleArray(smoothColorScale, smoothColorScale_size));

	// Add a text label centered at (150, 125) with 15pt Arial Italic font
	m->addText(150, 125, "CPU", "Arial Italic", 15, Chart::TextColor, Chart::BottomCenter);

	// Add a red (0xff0000) pointer at the specified value
	// addPointer() 메서드와 addPointer2() 메서드는 포인터의 모양이 약간 다르다.
	m->addPointer2(value, 0xff0000);

	// Create a wxChartViewer to display the meter, with a size of 300 x 180 pixels
	wxChartViewer* meterViewer = new wxChartViewer(panel, wxID_ANY, wxPoint(10, 10), wxSize(300, 180));
	meterViewer->setChart(m);

	//free up resources
	delete m;
}


※ 참고

ChartDirector Documentation

wxChartDir

wxChartDir Documentation


반응형
Posted by J-sean
:
반응형

wxCharts를 이용해 차트를 그려보자.


vcpkg install wxcharts

Include, Library 등을 적당히 세팅한다.


#include <wx/wx.h>
#include <wxcharts/wx/charts/wxchart.h> // wxCharts 라이브러리의 헤더 파일을 포함한다.
#include <wxcharts/wx/charts/wxbarchartctrl.h> // wxBarChartCtrl 클래스의 헤더 파일을 포함한다.

#pragma comment(lib, "wxchartsd.lib") // wxCharts 라이브러리를 링크한다.

class MyApp : public wxApp
{
public:
	bool OnInit() override;
};

wxIMPLEMENT_APP(MyApp);

class MyFrame : public wxFrame
{
public:
	MyFrame();

private:
	void OnHello(wxCommandEvent& event);
	void OnExit(wxCommandEvent& event);
	void OnAbout(wxCommandEvent& event);

	wxPanel* panel;
};

enum
{
	ID_Hello = 1
};

bool MyApp::OnInit()
{
	MyFrame* frame = new MyFrame();
	frame->Show(true);
	return true;
}

// 메인 프레임의 위치(default position)와 크기(550x400)를 설정한다.
MyFrame::MyFrame() : wxFrame(nullptr, wxID_ANY, "Hello World", wxDefaultPosition, wxSize(550, 400))
{
	wxMenu* menuFile = new wxMenu;
	menuFile->Append(ID_Hello, "&Hello...\tCtrl-H", "Help string shown in status bar for this menu item");
	menuFile->AppendSeparator();
	menuFile->Append(wxID_EXIT);

	wxMenu* menuHelp = new wxMenu;
	menuHelp->Append(wxID_ABOUT);

	wxMenuBar* menuBar = new wxMenuBar;
	menuBar->Append(menuFile, "&File");
	menuBar->Append(menuHelp, "&Help");

	SetMenuBar(menuBar);

	CreateStatusBar();
	SetStatusText("Welcome to wxWidgets!");

	panel = new wxPanel(this, wxID_ANY);

	wxButton* myButton = new wxButton(panel, wxID_ANY, "Press Me", wxPoint(420, 30), wxSize(100, 30));
	myButton->Bind(wxEVT_BUTTON, &MyFrame::OnHello, this);

	Bind(wxEVT_MENU, &MyFrame::OnHello, this, ID_Hello);
	Bind(wxEVT_MENU, &MyFrame::OnAbout, this, wxID_ABOUT);
	Bind(wxEVT_MENU, &MyFrame::OnExit, this, wxID_EXIT);
}

void MyFrame::OnExit(wxCommandEvent& event)
{
	Close(true);
}

void MyFrame::OnAbout(wxCommandEvent& event)
{
	wxMessageBox("This is a wxWidgets Hello World example", "About Hello World", wxOK | wxICON_INFORMATION);
}

void MyFrame::OnHello(wxCommandEvent& event)
{
	//wxLogMessage("Hello world from wxWidgets!");

	// wxCharts 라이브러리를 사용하여 막대 그래프를 생성
	// Create the data for the bar chart widget
	wxVector<wxString> labels;
	labels.push_back("January");
	labels.push_back("February");
	labels.push_back("March");
	labels.push_back("April");
	labels.push_back("May");
	labels.push_back("June");
	labels.push_back("July");
	wxChartsCategoricalData::ptr chartData = wxChartsCategoricalData::make_shared(labels);

	// Add the first dataset
	wxVector<wxDouble> points1;
	points1.push_back(3);
	points1.push_back(2.5);
	points1.push_back(1.2);
	points1.push_back(3);
	points1.push_back(6);
	points1.push_back(5);
	points1.push_back(1);
	wxChartsDoubleDataset::ptr dataset1(new wxChartsDoubleDataset("Dataset 1", points1));
	chartData->AddDataset(dataset1);

	// Add the second dataset
	wxVector<wxDouble> points2;
	points2.push_back(1);
	points2.push_back(1.33);
	points2.push_back(2.5);
	points2.push_back(2);
	points2.push_back(3);
	points2.push_back(1.8);
	points2.push_back(0.4);
	wxChartsDoubleDataset::ptr dataset2(new wxChartsDoubleDataset("Dataset 2", points2));
	chartData->AddDataset(dataset2);

	// Create the bar chart widget
	wxBarChartCtrl* barChartCtrl = new wxBarChartCtrl(panel, wxID_ANY, chartData);
	barChartCtrl->SetSize(400, 300);

	// Set up the sizer for the panel
	//wxBoxSizer* panelSizer = new wxBoxSizer(wxHORIZONTAL);
	//panelSizer->Add(barChartCtrl, 1, wxEXPAND);
	//panel->SetSizer(panelSizer);
}


버튼을 클릭한다.


Panel에 차트가 표시된다.


grid를 없애 보자.

void MyFrame::OnHello(wxCommandEvent& event)
{
	//wxLogMessage("Hello world from wxWidgets!");

	// wxCharts 라이브러리를 사용하여 막대 그래프를 생성
	// Create the data for the bar chart widget
	wxVector<wxString> labels;
	labels.push_back("January");
	labels.push_back("February");
	labels.push_back("March");
	labels.push_back("April");
	labels.push_back("May");
	labels.push_back("June");
	labels.push_back("July");
	wxChartsCategoricalData::ptr chartData = wxChartsCategoricalData::make_shared(labels);

	// Add the first dataset
	wxVector<wxDouble> points1;
	points1.push_back(3);
	points1.push_back(2.5);
	points1.push_back(1.2);
	points1.push_back(3);
	points1.push_back(6);
	points1.push_back(5);
	points1.push_back(1);
	wxChartsDoubleDataset::ptr dataset1(new wxChartsDoubleDataset("Dataset 1", points1));
	chartData->AddDataset(dataset1);

	// Add the second dataset
	wxVector<wxDouble> points2;
	points2.push_back(1);
	points2.push_back(1.33);
	points2.push_back(2.5);
	points2.push_back(2);
	points2.push_back(3);
	points2.push_back(1.8);
	points2.push_back(0.4);
	wxChartsDoubleDataset::ptr dataset2(new wxChartsDoubleDataset("Dataset 2", points2));
	chartData->AddDataset(dataset2);

	// barchart 옵션 설정
	wxBarChartOptions::ptr options(new wxBarChartOptions());

	// 라이브러리의 GetGridOptions()가 const 참조만 반환하므로
	// const_cast를 사용하여 상수성을 일시적으로 제거하여 옵션을 수정한다.
	wxChartsGridOptions& gridOptions = const_cast<wxChartsGridOptions&>(options->GetGridOptions());
	gridOptions.GetHorizontalGridLineOptions().SetShowGridLines(false);
	gridOptions.GetVerticalGridLineOptions().SetShowGridLines(false);

	// Create the bar chart widget with options
	wxBarChartCtrl* barChartCtrl = new wxBarChartCtrl(panel, wxID_ANY, chartData, options);
	barChartCtrl->SetSize(400, 300);

	// Set up the sizer for the panel
	//wxBoxSizer* panelSizer = new wxBoxSizer(wxHORIZONTAL);
	//panelSizer->Add(barChartCtrl, 1, wxEXPAND);
	//panel->SetSizer(panelSizer);
}


세로 막대 그래프를 그려 보자.

#include <wx/wx.h>
#include <wxcharts/wx/charts/wxchart.h> // wxCharts 라이브러리의 헤더 파일을 포함한다.
#include <wxcharts/wx/charts/wxcolumnchartctrl.h> // wxColumnChartCtrl 클래스의 헤더 파일을 포함한다.

#pragma comment(lib, "wxchartsd.lib") // wxCharts 라이브러리를 링크한다.

class MyApp : public wxApp
{
public:
	bool OnInit() override;
};

wxIMPLEMENT_APP(MyApp);

class MyFrame : public wxFrame
{
public:
	MyFrame();

private:
	void OnHello(wxCommandEvent& event);
	void OnExit(wxCommandEvent& event);
	void OnAbout(wxCommandEvent& event);

	wxPanel* panel;
};

enum
{
	ID_Hello = 1
};

bool MyApp::OnInit()
{
	MyFrame* frame = new MyFrame();
	frame->Show(true);
	return true;
}

// 메인 프레임의 위치(default position)와 크기(550x400)를 설정한다.
MyFrame::MyFrame() : wxFrame(nullptr, wxID_ANY, "Hello World", wxDefaultPosition, wxSize(550, 400))
{
	wxMenu* menuFile = new wxMenu;
	menuFile->Append(ID_Hello, "&Hello...\tCtrl-H", "Help string shown in status bar for this menu item");
	menuFile->AppendSeparator();
	menuFile->Append(wxID_EXIT);

	wxMenu* menuHelp = new wxMenu;
	menuHelp->Append(wxID_ABOUT);

	wxMenuBar* menuBar = new wxMenuBar;
	menuBar->Append(menuFile, "&File");
	menuBar->Append(menuHelp, "&Help");

	SetMenuBar(menuBar);

	CreateStatusBar();
	SetStatusText("Welcome to wxWidgets!");

	panel = new wxPanel(this, wxID_ANY);

	wxButton* myButton = new wxButton(panel, wxID_ANY, "Press Me", wxPoint(420, 30), wxSize(100, 30));
	myButton->Bind(wxEVT_BUTTON, &MyFrame::OnHello, this);

	Bind(wxEVT_MENU, &MyFrame::OnHello, this, ID_Hello);
	Bind(wxEVT_MENU, &MyFrame::OnAbout, this, wxID_ABOUT);
	Bind(wxEVT_MENU, &MyFrame::OnExit, this, wxID_EXIT);
}

void MyFrame::OnExit(wxCommandEvent& event)
{
	Close(true);
}

void MyFrame::OnAbout(wxCommandEvent& event)
{
	wxMessageBox("This is a wxWidgets Hello World example", "About Hello World", wxOK | wxICON_INFORMATION);
}

void MyFrame::OnHello(wxCommandEvent& event)
{
	//wxLogMessage("Hello world from wxWidgets!");

	// wxCharts 라이브러리를 사용하여 막대 그래프를 생성
	// Create the data for the bar chart widget
	wxVector<wxString> labels;
	labels.push_back("January");
	labels.push_back("February");
	labels.push_back("March");
	labels.push_back("April");
	labels.push_back("May");
	labels.push_back("June");
	labels.push_back("July");
	wxChartsCategoricalData::ptr chartData = wxChartsCategoricalData::make_shared(labels);

	// Add the first dataset
	wxVector<wxDouble> points1;
	points1.push_back(3);
	points1.push_back(2.5);
	points1.push_back(1.2);
	points1.push_back(3);
	points1.push_back(6);
	points1.push_back(5);
	points1.push_back(1);
	wxChartsDoubleDataset::ptr dataset1(new wxChartsDoubleDataset("Dataset 1", points1));
	chartData->AddDataset(dataset1);

	// Add the second dataset
	wxVector<wxDouble> points2;
	points2.push_back(1);
	points2.push_back(1.33);
	points2.push_back(2.5);
	points2.push_back(2);
	points2.push_back(3);
	points2.push_back(1.8);
	points2.push_back(0.4);
	wxChartsDoubleDataset::ptr dataset2(new wxChartsDoubleDataset("Dataset 2", points2));
	chartData->AddDataset(dataset2);

	// Create the column chart widget (Month가 X축에 표시됨)
	wxColumnChartCtrl* columnChartCtrl = new wxColumnChartCtrl(panel, wxID_ANY, chartData);
	columnChartCtrl->SetSize(400, 300);

	// Set up the sizer for the panel
	//wxBoxSizer* panelSizer = new wxBoxSizer(wxHORIZONTAL);
	//panelSizer->Add(columnChartCtrl, 1, wxEXPAND);
	//panel->SetSizer(panelSizer);
}


세로 막대 그래프가 표시된다.


세로 막대 그래프는 wxColumnChartOptions::prt가 없어서 grid를 없애지 못한다. 아직 완전한 라이브러리는 아닌 것 같다.


라인 차트를 그려보자.

#include <wx/wx.h>
#include <wxcharts/wx/charts/wxchart.h> // wxchart.h 헤더 파일을 포함한다.
#include <wxcharts/wx/charts/wxlinechartctrl.h> // wxlinechartctrl.h 헤더 파일을 포함한다.

#pragma comment(lib, "wxchartsd.lib") 

class MyApp : public wxApp
{
public:
	bool OnInit() override;
};

wxIMPLEMENT_APP(MyApp);

class MyFrame : public wxFrame
{
public:
	MyFrame();

private:
	void OnHello(wxCommandEvent& event);
	void OnExit(wxCommandEvent& event);
	void OnAbout(wxCommandEvent& event);

	wxPanel* panel;
};

enum
{
	ID_Hello = 1
};

bool MyApp::OnInit()
{
	MyFrame* frame = new MyFrame();
	frame->Show(true);
	return true;
}

// 메인 프레임의 위치(default position)와 크기(550x400)를 설정한다.
MyFrame::MyFrame() : wxFrame(nullptr, wxID_ANY, "Hello World", wxDefaultPosition, wxSize(550, 400))
{
	wxMenu* menuFile = new wxMenu;
	menuFile->Append(ID_Hello, "&Hello...\tCtrl-H", "Help string shown in status bar for this menu item");
	menuFile->AppendSeparator();
	menuFile->Append(wxID_EXIT);

	wxMenu* menuHelp = new wxMenu;
	menuHelp->Append(wxID_ABOUT);

	wxMenuBar* menuBar = new wxMenuBar;
	menuBar->Append(menuFile, "&File");
	menuBar->Append(menuHelp, "&Help");

	SetMenuBar(menuBar);

	CreateStatusBar();
	SetStatusText("Welcome to wxWidgets!");

	panel = new wxPanel(this, wxID_ANY);

	wxButton* myButton = new wxButton(panel, wxID_ANY, "Press Me", wxPoint(420, 30), wxSize(100, 30));
	myButton->Bind(wxEVT_BUTTON, &MyFrame::OnHello, this);

	Bind(wxEVT_MENU, &MyFrame::OnHello, this, ID_Hello);
	Bind(wxEVT_MENU, &MyFrame::OnAbout, this, wxID_ABOUT);
	Bind(wxEVT_MENU, &MyFrame::OnExit, this, wxID_EXIT);
}

void MyFrame::OnExit(wxCommandEvent& event)
{
	Close(true);
}

void MyFrame::OnAbout(wxCommandEvent& event)
{
	wxMessageBox("This is a wxWidgets Hello World example", "About Hello World", wxOK | wxICON_INFORMATION);
}

void MyFrame::OnHello(wxCommandEvent& event)
{
	wxVector<wxString> labels;
	labels.push_back("2023-01-01");
	labels.push_back("2023-01-02");
	labels.push_back("2023-01-03");
	labels.push_back("2023-01-04");
	labels.push_back("2023-01-05");
	wxChartsCategoricalData::ptr chartData = wxChartsCategoricalData::make_shared(labels);

	wxVector<wxDouble> points;
	points.push_back(3);
	points.push_back(2.5);
	points.push_back(1.2);
	points.push_back(3);
	points.push_back(6);
	wxChartsDoubleDataset::ptr dataset1(new wxChartsDoubleDataset("Data", points));
	chartData->AddDataset(dataset1);

	// Create the line chart widget
	wxLineChartCtrl* lineChartCtrl = new wxLineChartCtrl(panel, wxID_ANY, chartData, wxCHARTSLINETYPE_STRAIGHT, wxDefaultPosition, wxDefaultSize, wxBORDER_DEFAULT);
	lineChartCtrl->SetSize(400, 300);

	// Set up the sizer for the panel
	//wxBoxSizer* panelSizer = new wxBoxSizer(wxHORIZONTAL);
	//panelSizer->Add(lineChartCtrl, 1, wxEXPAND);
	//panel->SetSizer(panelSizer);
}


timeseries 차트는 아직 구현이 제대로 된 것 같지 않다. 사용할 수가 없어 라인 차트를 만들어 본 것이다.

아직 제대로 된 튜토리얼이나 문서도 없다. 아래 샘플을 참고하자.


※ 참고

wxCharts

Samples


반응형
Posted by J-sean
:
반응형

LiveCharts2를 설치하고 간단한 차트를 그려보자.


Windows Forms App을 선택한다.


Windows Forms App (.NET Framework)를 선택하면 빌드 후 실행 시 에러가 발생한다.


LiveChartsCore.SkiaSharpView.WinForms를 설치한다.


Form에 버튼을 하나 배치한다.


using LiveChartsCore;
using LiveChartsCore.SkiaSharpView;
using LiveChartsCore.SkiaSharpView.Drawing.Geometries;
using LiveChartsCore.SkiaSharpView.Painting;
using LiveChartsCore.SkiaSharpView.VisualElements;
using LiveChartsCore.SkiaSharpView.WinForms;
using SkiaSharp;

namespace WinFormsApp1
{
    public partial class Form1 : Form
    {
        private bool _isChartDrawn = false;

        public Form1()
        {
            InitializeComponent();

            button1.Click += Button1_Click;
        }

        private void Button1_Click(object? sender, EventArgs e)
        {
            if (_isChartDrawn) return;
            _isChartDrawn = true;

            double[] values1 = new double[] { 2, 1, 3, 5, 3, 4, 6 };
            int[] values2 = new int[] { 4, 2, 5, 2, 4, 5, 3 };

            ISeries[] series = new ISeries[]
            {
                new LineSeries<double>
                {
                    Values = values1,
                    Fill = null,
                    GeometrySize = 20
                },
                new LineSeries<int, StarGeometry>
                {
                    Values = values2,
                    Fill = null,
                    GeometrySize = 20
                }
            };

            DrawnLabelVisual title = new DrawnLabelVisual(
                new LabelGeometry
                {
                    Text = "My chart title",
                    Paint = new SolidColorPaint(SKColor.Parse("#303030")),
                    TextSize = 25,
                    Padding = new LiveChartsCore.Drawing.Padding(15),
                    // padding은 텍스트와 라벨의 경계 사이의 간격을 지정하는 속성이다.
                    // 위 코드에서는 15로 설정되어 있어 텍스트와 라벨의 경계 사이에 15픽셀의 간격이 생긴다.
                    VerticalAlign = LiveChartsCore.Drawing.Align.Start,
                    // vertical align은 Start, Middle, End가 있다. Start는 위쪽, Middle은 가운데, End는 아래쪽에 위치한다.
                    HorizontalAlign = LiveChartsCore.Drawing.Align.Start
                    // horizontal align은 Start, Middle, End가 있다. Start는 왼쪽, Middle은 가운데, End는 오른쪽에 위치한다.
                });

            CartesianChart cartesianChart = new CartesianChart
            {
                Series = series,
                Title = title,
                Location = new System.Drawing.Point(0, 0),
                Size = new System.Drawing.Size(800, 300),
                //Anchor = AnchorStyles.Left | AnchorStyles.Right | AnchorStyles.Top | AnchorStyles.Bottom
                // 위 코드와 같이 Anchor를 지정하면 폼의 크기가 변경될 때 차트의 크기가 자동으로 조정되는데 그려진 비율이 유지되는게 아니라
                // 그려지지 않은 부분의 사이즈가 그대로 유지되는 방식으로 조정된다.
            };

            Controls.Add(cartesianChart);
        }
    }
}


코드를 입력하고 빌드한다.


버튼을 클릭하면 차트가 표시된다.


이번엔 차트에 Zoom & Pan 모드를 설정해 보자.

using LiveChartsCore;
using LiveChartsCore.SkiaSharpView;
using LiveChartsCore.SkiaSharpView.WinForms;

namespace WinFormsApp1
{
    public partial class Form1 : Form
    {
        private bool _isChartAdded = false;

        public Form1()
        {
            InitializeComponent();

            button1.Click += Button1_Click;
        }

        private void Button1_Click(object? sender, EventArgs e)
        {
            if (_isChartAdded) return;
            _isChartAdded = true;

            int[] values = Fetch();
            ISeries[] series = new ISeries[]
            {
                new LineSeries<int>
                {
                    Values = values
                }
            };

            CartesianChart cartesianChart = new CartesianChart
            {
                Series = series,
                ZoomMode = LiveChartsCore.Measure.ZoomAndPanMode.X, // X: Enables zooming and panning on the X axis.
                // 줌 및 팬 모드를 설정하여 X축에서만 작동하도록 지정한다.
                Location = new System.Drawing.Point(0, 0),
                Size = new System.Drawing.Size(800, 300),
                //Anchor = AnchorStyles.Left | AnchorStyles.Right | AnchorStyles.Top | AnchorStyles.Bottom
            };

            Controls.Add(cartesianChart);
        }

        private static int[] Fetch()
        {
            int[] values = new int[100];
            Random r = new Random();
            int t = 0;

            for (int i = 0; i < 100; i++)
            {
                t += r.Next(-90, 100);
                values[i] = t;
            }

            return values;
        }
    }
}


코드를 빌드하고 실행한다.


왼쪽 버튼: Pan

오른쪽 버튼: Select

휠: Zoom


실시간 업데이트 차트를 만들어 보자.

using LiveChartsCore;
using LiveChartsCore.Defaults;
using LiveChartsCore.SkiaSharpView;
using LiveChartsCore.SkiaSharpView.Painting;
using LiveChartsCore.SkiaSharpView.WinForms;
using SkiaSharp;
using System.Collections.ObjectModel;

namespace WinFormsApp1
{
    public partial class Form1 : Form
    {
        private readonly ObservableCollection<DateTimePoint> _values = new ObservableCollection<DateTimePoint>();
        private readonly object _sync = new object();
        private bool _isReading = true;
        private double[] _separators = Array.Empty<double>();
        private readonly CartesianChart _cartesianChart = new CartesianChart();
        private bool _isChartAdded = false;

        public Form1()
        {
            InitializeComponent();

            button1.Click += Button1_Click;
        }

        private void Button1_Click(object? sender, EventArgs e)
        {
            if (_isChartAdded) return; // 차트가 이미 추가된 경우, 중복 추가 방지
            _isChartAdded = true;

            ISeries[] seriesColection = new ISeries[]
            {
                new LineSeries<DateTimePoint>
                {
                    Values = _values,
                    Fill = null,
                    GeometryFill = null,
                    GeometryStroke = null
                }
            };

            Axis xAxis = new Axis
            {
                Labeler = value => Formatter(new DateTime((long)value)),
                AnimationsSpeed = TimeSpan.FromMilliseconds(0),
                SeparatorsPaint = new SolidColorPaint(SKColors.Gray),
                CustomSeparators = _separators
            };

            _cartesianChart.Series = seriesColection;
            _cartesianChart.XAxes = [xAxis];
            _cartesianChart.Location = new System.Drawing.Point(0, 0);
            _cartesianChart.Size = new System.Drawing.Size(800, 300);
            //_cartesianChart.Anchor = AnchorStyles.Left | AnchorStyles.Right | AnchorStyles.Top | AnchorStyles.Bottom;

            Controls.Add(_cartesianChart);
            // 중복 추가를 방지하기 위해 폼 컨트롤에 있는지 아래와 같이 확인할 수도 있다.
            //if (!Controls.Contains(_cartesianChart))
            //    Controls.Add(_cartesianChart);

            _ = ReadData(xAxis);
            // _ = 는 비동기 메서드의 반환값(Task)을 무시하기 위한 구문이다. 반환값은 주로 비동기 작업의 완료를 나타내는
            // Task 객체이지만, 여기서는 반환값을 사용하지 않으므로 _ = 구문을 사용하여 명시적으로 무시한다.
            // 이게 없으면 컴파일러가 반환값이 사용되지 않았다고 경고한다.
        }
        private async Task ReadData(Axis xAxis) // 데이터를 비동기적으로 읽어와 차트에 업데이트하는 메서드
        {
            Random random = new Random();
            while (_isReading)
            {
                await Task.Delay(100);
                lock (_sync)
                {
                    _values.Add(new DateTimePoint(DateTime.Now, random.Next(0, 10)));
                    // DateTimePoint: 날짜와 값을 함께 저장하는 클래스
                    if (_values.Count > 250) _values.RemoveAt(0);
                    _separators = GetSeparators();
                    xAxis.CustomSeparators = _separators;
                }
            }
        }

        private static double[] GetSeparators() // 차트의 X축에 표시할 구분자(시간 간격)를 생성하는 메서드
        {
            DateTime now = DateTime.Now;
            return new double[]
            {
                now.AddSeconds(-25).Ticks,
                now.AddSeconds(-20).Ticks,
                now.AddSeconds(-15).Ticks,
                now.AddSeconds(-10).Ticks,
                now.AddSeconds(-5).Ticks,
                now.Ticks
            };
        }

        private static string Formatter(DateTime date) // X축 레이블을 포맷팅하는 메서드
        {
            double secsAgo = (DateTime.Now - date).TotalSeconds;
            return secsAgo < 1 ? "now" : $"{secsAgo:N0}s ago";
            // "N0"는 소수점 없는 숫자 형식 지정자.
        }
    }
}


빌드하고 실행한다.


※ 참고

2026.05.15 - [Raspberry Pi & Arduino] - [Arduino] FIS Low concentration solvent gas sensor module


Angular Gauge를 만들어 보자.

using LiveChartsCore.Defaults;
using LiveChartsCore.SkiaSharpView;
using LiveChartsCore.SkiaSharpView.Extensions;
using LiveChartsCore.SkiaSharpView.Painting;
using LiveChartsCore.SkiaSharpView.VisualElements;
using LiveChartsCore.SkiaSharpView.WinForms;
using SkiaSharp;

namespace WinFormsApp1
{
    public partial class Form1 : Form
    {
        private readonly PieChart pieChart = new PieChart();
        private readonly Random random = new Random();
        private bool _isChartAdded = false;

        public Form1()
        {
            InitializeComponent();

            button1.Click += Button1_Click;
        }

        private void Button1_Click(object? sender, EventArgs e)
        {
            if (_isChartAdded) return; // 차트가 이미 추가된 경우, 중복 추가 방지
            _isChartAdded = true;

            double sectionsOuter = 130; // 섹션의 외부 반경 오프셋
            double sectionsWidth = 20; // 섹션의 최대 반경 너비

            NeedleVisual needle = new NeedleVisual
            {
                Value = 45 // 바늘이 가리키는 값 (pieChart MinValue와 MaxValue 사이)
            };

            pieChart.Series = GaugeGenerator.BuildAngularGaugeSections(
                    new GaugeItem(60, s => SetStyle(sectionsOuter, sectionsWidth, SKColors.LimeGreen, s)), // 첫 번째 섹션: 60% 비율, 녹색
                    new GaugeItem(30, s => SetStyle(sectionsOuter, sectionsWidth, SKColors.Gold, s)),      // 두 번째 섹션: 30% 비율, 노란색
                    new GaugeItem(10, s => SetStyle(sectionsOuter, sectionsWidth, SKColors.Crimson, s)));  // 세 번째 섹션: 10% 비율, 빨간색
            pieChart.VisualElements = [
                new AngularTicksVisual
                {
                    Labeler = value => value.ToString("N1"), // 눈금 레이블 포맷, N1은 소수점 한 자리까지 표시
                    LabelsSize = 16,
                    LabelsOuterOffset = 15,
                    OuterOffset = 65,
                    TicksLength = 20
                },
                needle
                ];
            pieChart.InitialRotation = -225; // 시작 각도 설정
            pieChart.MaxAngle = 270; // 게이지가 차지하는 각도 설정
            pieChart.MinValue = 0; // 게이지의 최소값 설정
            pieChart.MaxValue = 100; // 게이지의 최대값 설정
            pieChart.Location = new System.Drawing.Point(0, 0);
            pieChart.Size = new System.Drawing.Size(400, 400);
            // 바늘(및 차트 전체)의 애니메이션 회전 속도를 늘리거나 줄일 수 있다.
            // 기본값은 약 500밀리초. 아래 설정은 3초(3000밀리초) 동안 부드럽게 회전하도록 한다.
            pieChart.AnimationsSpeed = TimeSpan.FromMilliseconds(3000);
            // 애니메이션의 움직임(Easing) 방식을 지정할 수도 있다.
             pieChart.EasingFunction = LiveChartsCore.EasingFunctions.BounceOut;
            //Anchor = AnchorStyles.Left | AnchorStyles.Right | AnchorStyles.Top | AnchorStyles.Bottom;

            Controls.Add(pieChart);

            Button b1 = new Button
            {
                Text = "Update",
                Location = new System.Drawing.Point(400, 300),
                Size = new System.Drawing.Size(100, 50)
            };
            b1.Click += (sender, e) => needle.Value = random.Next(0, 100);
            Controls.Add(b1);
            b1.BringToFront();
        }

        private static void SetStyle(double sectionsOuter, double sectionsWidth, SKColor color, PieSeries<ObservableValue> series)
        {
            series.OuterRadiusOffset = sectionsOuter; // 섹션의 외부 반경 오프셋 설정
            series.MaxRadialColumnWidth = sectionsWidth; // 섹션의 최대 반경 너비 설정
            series.CornerRadius = 0; // 섹션의 모서리 반경 설정
            series.Fill = new SolidColorPaint(color); // 섹션의 칠하기 색상 설정
        }
    }
}


※ 참고

Toolbox - LiveChartsCore.SkiaSharpView.WinForms 툴은 사용하지 말자. 그리는 건 되지만 지울 수가 없다.


LiveCharts는 코드로만 작성하거나 코드로 UserControl을 만들어 Toolbox에서 사용해야 한다.


※ 참고

LiveCharts2 (화면 상단의 Framework를 WinForms 등 원하는대로 선택해야 한다)


반응형
Posted by J-sean
:
반응형

MySQL(MariaDB)과 구글 차트를 연동해 보자.


아래 내용을 참고해 웹서버와 데이터베이스를 준비한다.

2021.08.25 - [Linux] - Linux(Ubuntu) Build Your Own Web Server - 리눅스(우분투)로 웹서버 만들기

2021.08.28 - [Linux] - Linux(Ubuntu) MariaDB(MySQL) Server Remote Access - 데이터베이스 원격 접속

(데이터베이스는 로컬로 사용하므로 원격 설정을 할 필요는 없다)


위와 같은 데이터베이스와 테이블을 생성한다.


시간, 온도, 습도 데이터를 적당히 입력한다.


1
2
3
4
5
6
7
8
9
10
11
12
13
14
15
16
17
18
19
20
21
22
23
24
25
26
27
28
29
30
31
32
33
34
35
36
37
38
39
40
41
42
43
44
45
46
47
48
49
50
51
52
53
54
55
56
57
58
59
60
61
62
63
64
65
66
67
68
69
70
71
72
73
74
75
76
77
78
79
80
81
82
83
84
85
86
87
88
89
90
91
92
93
94
95
96
<html>
<head>
    <script type="text/javascript" src="https://www.gstatic.com/charts/loader.js"></script>
    <script src="http://ajax.googleapis.com/ajax/libs/jquery/1.11.2/jquery.min.js"></script>
    <!--
    <script type="text/javascript" src="http://code.jquery.com/jquery-1.11.2.min.js"></script>
    -->
 
    <?php
        // 에러가 발생하면 내용 표시
        error_reporting(E_ALL);
        ini_set('display_errors''1');
 
        $mysql_host = "localhost";
        $mysql_user = "root";
        $mysql_password = "1234";
        $mysql_db = "test_db";
 
        $conn = mysqli_connect($mysql_host$mysql_user$mysql_password$mysql_db);
        if (!$conn) {
            die("Database Connect Error: " . mysqli_connect_error());
        }
            
        //echo "Database Connected.<br><br>";
            
        $sql = "SELECT * FROM test_tb";
        $result = mysqli_query($conn$sql);
        
        if (mysqli_num_rows($result> 0) {
            while ($row = mysqli_fetch_assoc($result)) {
                $data_array[] = $row;
            }
            $chart = json_encode($data_array);
        } else {
            echo "No Data";
        }
        
        //echo $chart;
 
        mysqli_close($conn);
    ?>
 
    <script type="text/javascript">
        google.charts.load('current', { packages: ['corechart''line'] });
        google.charts.setOnLoadCallback(drawChart);
        
        function drawChart() {
            var chart_array = <?php echo $chart; ?>;
            //console.log(JSON.stringify(chart_array))
            var header = ['dt''temp''humid'];
            var row = "";
            var rows = new Array();
            jQuery.each(chart_array, function(index, item) {
                row = [
                    item.dt,
                    Number(item.temp),
                    Number(item.humid)
                ];
                rows.push(row); 
            });
 
            var jsonData = [header].concat(rows);
            var data = new google.visualization.arrayToDataTable(jsonData);
            var options = {
                title: 'Temperaure & Humid',
                hAxis: {
                    title: 'Time'
                },
                series: {
                    0: { targetAxisIndex: 0 },
                    1: { targetAxisIndex: 1 }
                },
                vAxes: {
                    0: {
                        title: 'Temperature',
                        viewWindow: { min: -30, max: 50 }
                    },
                    1: {
                        title: 'Humid',
                        viewWindow: { min: 30, max: 100 }
                    }
                }
                //,
                //curveType: 'function',
                //legend: { position: 'bottom' }
            };
 
            var chart = new google.visualization.LineChart(document.getElementById('chart_div'));
            chart.draw(data, options);
        }
    </script>
</head>
<body>
    <div id="chart_div" style="width: 900px; height: 500px"></div>
</body>
</html>


소스를 입력하고 웹서버에 저장한다.(/var/www/html/index.php)


웹서버에 접속하면 위와 같은 그래프가 표시된다.


X축 레이블을 좀 더 보기 편하게 바꾸고 테이블 차트도 추가해 보자.


1
2
3
4
5
6
7
8
9
10
11
12
13
14
15
16
17
18
19
20
21
22
23
24
25
26
27
28
29
30
31
32
33
34
35
36
37
38
39
40
41
42
43
44
45
46
47
48
49
50
51
52
53
54
55
56
57
58
59
60
61
62
63
64
65
66
67
68
69
70
71
72
73
74
75
76
77
78
79
80
81
82
83
84
85
86
87
88
89
90
91
92
93
94
95
96
97
98
99
100
101
102
103
104
105
106
107
108
109
110
<html>
<head>
    <script type="text/javascript" src="https://www.gstatic.com/charts/loader.js"></script>
    <script src="http://ajax.googleapis.com/ajax/libs/jquery/1.11.2/jquery.min.js"></script>
    <!--
    <script type="text/javascript" src="http://code.jquery.com/jquery-1.11.2.min.js"></script>
    -->
 
    <?php
        // 에러가 발생하면 내용 표시
        error_reporting(E_ALL);
        ini_set('display_errors''1');
 
        $mysql_host = "localhost";
        $mysql_user = "root";
        $mysql_password = "1234";
        $mysql_db = "test_db";
 
        $conn = mysqli_connect($mysql_host$mysql_user$mysql_password$mysql_db);
        if (!$conn) {
            die("Database Connect Error: " . mysqli_connect_error());
        }
            
        //echo "Database Connected.<br><br>";
            
        $sql = "SELECT * FROM test_tb";
        $result = mysqli_query($conn$sql);
        
        if (mysqli_num_rows($result> 0) {
            while ($row = mysqli_fetch_assoc($result)) {
                $data_array[] = $row;
            }
            $chart = json_encode($data_array);
        } else {
            echo "No Data";
        }
        
        //echo $chart;
 
        mysqli_close($conn);
    ?>
 
    <script type="text/javascript">
        google.charts.load('current', { packages: ['corechart''line'] });
        google.charts.load('current', { packages: ['table'] });
        google.charts.setOnLoadCallback(drawChart);
        
        function drawChart() {
            var chart_array = <?php echo $chart; ?>;
            //console.log(JSON.stringify(chart_array))
            var header = ['Date&Time(MM-DD HH:MM)''Temp''Humid'];
            var row = "";
            var rows = new Array();
            jQuery.each(chart_array, function(index, item) {
                row = [
                    item.dt.substr(511),  // 너무 긴 날짜 및 시간을 짧게 추출
                    Number(item.temp),
                    Number(item.humid)
                ];
                rows.push(row); 
            });
 
            var jsonData = [header].concat(rows);
            var data = new google.visualization.arrayToDataTable(jsonData);
 
            var lineChartOptions = {
                title: 'Temperaure & Humid',
                hAxis: {
                    title: 'Time',
                    showTextEvery: 4    // X축 레이블이 너무 많아 보기 힘드므로 4개마다 하나씩 표시
                },
                series: {
                    0: { targetAxisIndex: 0 },
                    1: { targetAxisIndex: 1 }
                },
                vAxes: {
                    0: {
                        title: 'Temperature',
                        viewWindow: { min: -30, max: 50 }
                    },
                    1: {
                        title: 'Humid',
                        viewWindow: { min: 30, max: 100 }
                    }
                }
                //,
                //curveType: 'function',
                //legend: { position: 'bottom' }
            };
 
            var lineChart = new google.visualization.LineChart(document.getElementById('lineChart_div'));
            lineChart.draw(data, lineChartOptions);
 
            // 테이블 차트
            var tableChartOptions = {
                showRowNumber: true,
                width: '40%',
                height: '20%'
            }
 
            var tableChart = new google.visualization.Table(document.getElementById('tableChart_div'));
            tableChart.draw(data, tableChartOptions);
        }
    </script>
</head>
<body>
    <div id="lineChart_div" style="width: 900px; height: 500px"></div>
    <div id="tableChart_div"></div>
</body>
</html>


소스를 수정하고 웹서버에 저장한다.(/var/www/html/index.php)


웹서버에 접속하면 위와 같은 그래프와 차트가 표시된다.


※ 참고

2022.05.05 - [Web Development] - Google Chart - 구글 차트 1

반응형
Posted by J-sean
:
반응형

구글 차트를 이용해 웹페이지에 그래프(Dual-Y Chart)를 그려보자.


서버가 필요하다면 아래 링크를 참고해 서버를 만든다.

2021.08.25 - [Linux] - Linux(Ubuntu) Build Your Own Web Server - 리눅스(우분투)로 웹서버 만들기


1
2
3
4
5
6
7
8
9
10
11
12
13
14
15
16
17
18
19
20
21
22
23
24
25
26
27
28
29
30
31
32
33
34
35
36
37
38
39
40
41
42
43
44
45
46
47
48
49
50
51
52
53
54
55
56
57
58
59
60
61
62
<html>
<head>
    <script type="text/javascript" src="https://www.gstatic.com/charts/loader.js"></script>
    <script type="text/javascript">
        google.charts.load('current', { packages: ['corechart''line'] });
        google.charts.setOnLoadCallback(drawChart);
 
        function drawChart() {
            var data = new google.visualization.DataTable();
            data.addColumn('datetime''Time');
            data.addColumn('number''Temperature');
            data.addColumn('number''Humid');
 
            data.addRows([
                // 00: 1월, 01: 2월, 02: 3월...
                [new Date(202203011130), 2570],
                [new Date(202203021130), 2672],
                [new Date(202203031130), 2775],
                [new Date(202203041130), 2977],
                [new Date(202203051130), 2474],
                [new Date(202203061130), 2671],
                [new Date(202203071130), 2974],
                [new Date(202203081130), 3172],
                [new Date(202203091130), 3369],
                [new Date(202203101130), 2975],
                [new Date(202203111130), 3272],
                [new Date(202203121130), 3171]
            ]);
 
            var options = {
                title: 'Temperaure & Humid',
                hAxis: {
                    title: 'Time'
                },
                series: {
                    0: { targetAxisIndex: 0 },
                    1: { targetAxisIndex: 1 }
                },
                vAxes: {
                    0: {
                        title: 'Temperature',
                        viewWindow: { min: -30, max: 50 }
                    },
                    1: {
                        title: 'Humid',
                        viewWindow: { min: 30, max: 100 }
                    }
                }
                //,
                //curveType: 'function',
                //legend: { position: 'bottom' }
            };
 
            var chart = new google.visualization.LineChart(document.getElementById('chart_div'));
            chart.draw(data, options);
        }
    </script>
</head>
<body>
    <div id="chart_div" style="width: 900px; height: 500px"></div>
</body>
</html>


HTML소스를 입력하고 저장한다.


인터넷 브라우저로 열어보면 그래프가 나타난다.


※ 참고

Google Charts

반응형
Posted by J-sean
: