<html>
<head>
<script type="text/javascript" src="https://www.gstatic.com/charts/loader.js"></script>
<script type="text/javascript">
google.charts.load('current', { packages: ['corechart', 'line'] });
google.charts.setOnLoadCallback(drawChart);
function drawChart() {
var data = new google.visualization.DataTable();
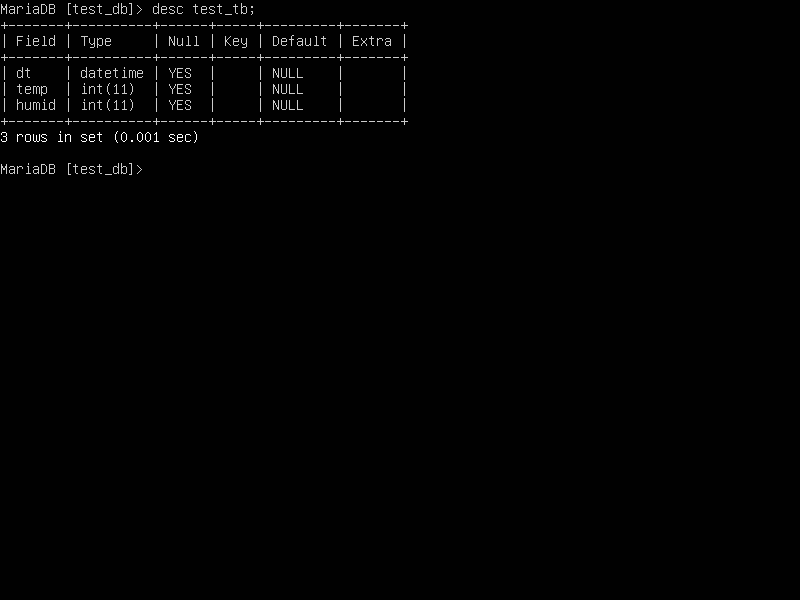
data.addColumn('datetime', 'Time');
data.addColumn('number', 'Temperature');
data.addColumn('number', 'Humid');
data.addRows([
// 00: 1월, 01: 2월, 02: 3월...
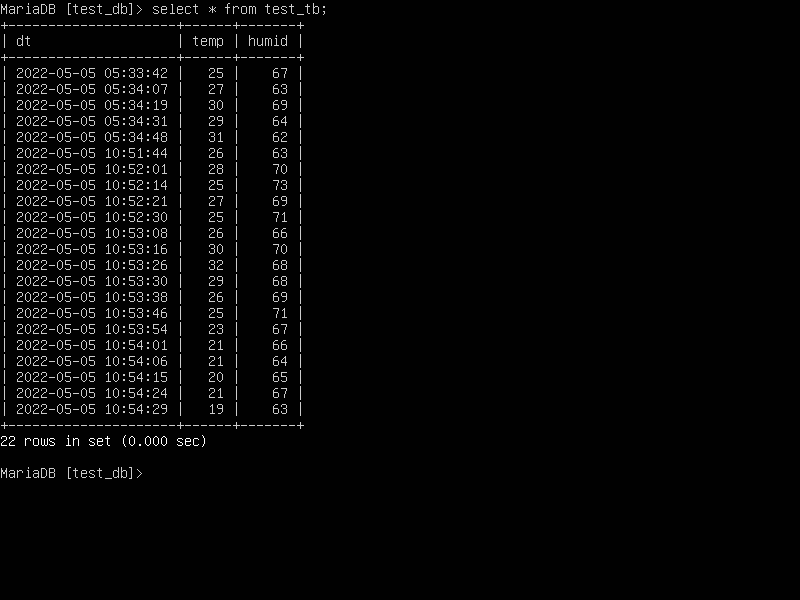
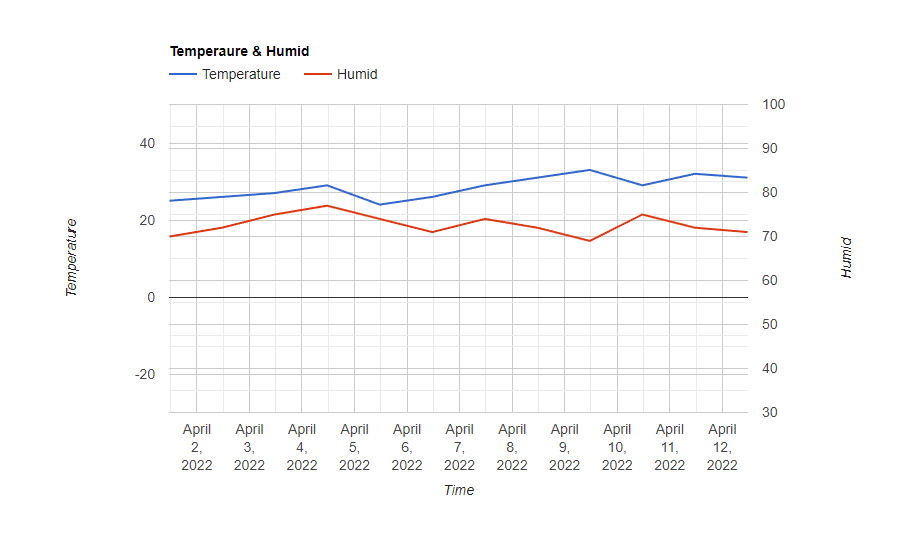
[new Date(2022, 03, 01, 11, 30), 25, 70],
[new Date(2022, 03, 02, 11, 30), 26, 72],
[new Date(2022, 03, 03, 11, 30), 27, 75],
[new Date(2022, 03, 04, 11, 30), 29, 77],
[new Date(2022, 03, 05, 11, 30), 24, 74],
[new Date(2022, 03, 06, 11, 30), 26, 71],
[new Date(2022, 03, 07, 11, 30), 29, 74],
[new Date(2022, 03, 08, 11, 30), 31, 72],
[new Date(2022, 03, 09, 11, 30), 33, 69],
[new Date(2022, 03, 10, 11, 30), 29, 75],
[new Date(2022, 03, 11, 11, 30), 32, 72],
[new Date(2022, 03, 12, 11, 30), 31, 71]
]);
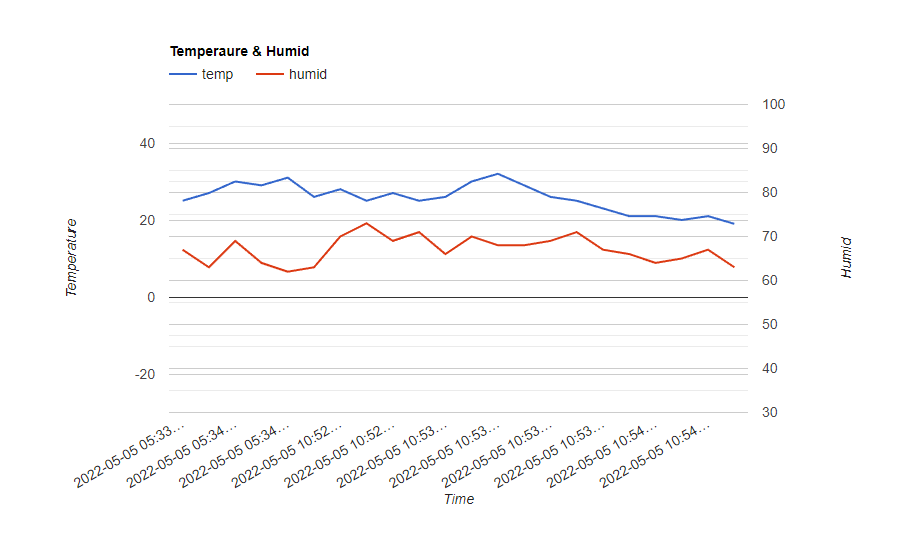
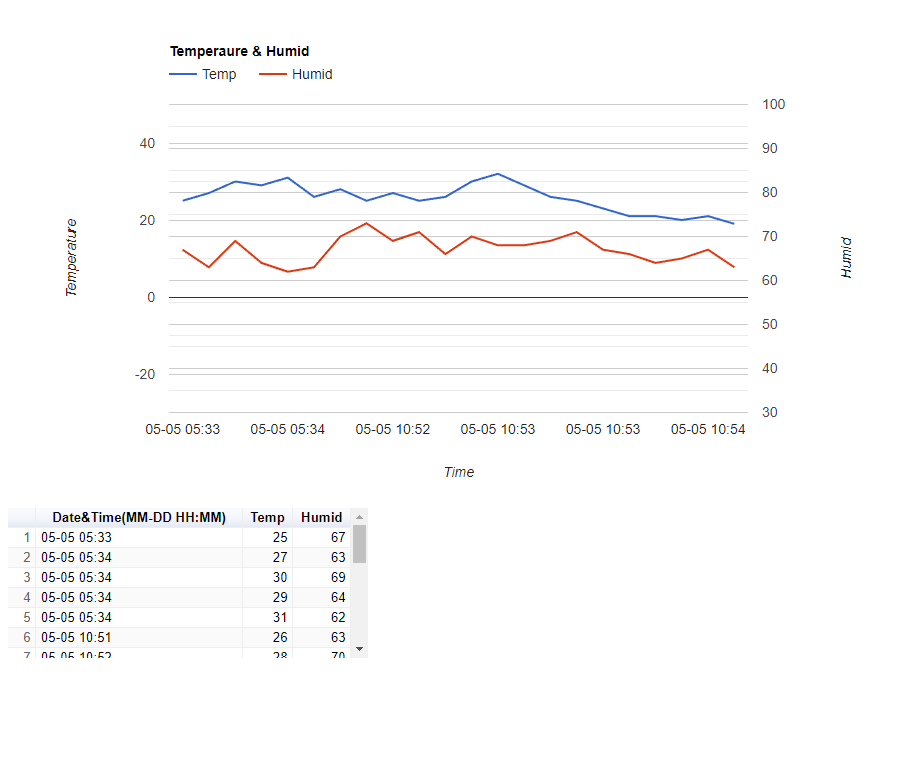
var options = {
title: 'Temperaure & Humid',
hAxis: {
title: 'Time'
},
series: {
0: { targetAxisIndex: 0 },
1: { targetAxisIndex: 1 }
},
vAxes: {
0: {
title: 'Temperature',
viewWindow: { min: -30, max: 50 }
},
1: {
title: 'Humid',
viewWindow: { min: 30, max: 100 }
}
}
//,
//curveType: 'function',
//legend: { position: 'bottom' }
};
var chart = new google.visualization.LineChart(document.getElementById('chart_div'));
chart.draw(data, options);
}
</script>
</head>
<body>
<div id="chart_div" style="width: 900px; height: 500px"></div>
</body>
</html>